. 2016 Aug 25;16(1):107.
doi: 10.1186/s12874-016-0209-0.

A computational approach to compare regression modelling strategies in prediction research

Affiliations

A computational approach to compare regression modelling strategies in prediction research

Romin Pajouheshnia et al. BMC Med Res Methodol. .

Abstract

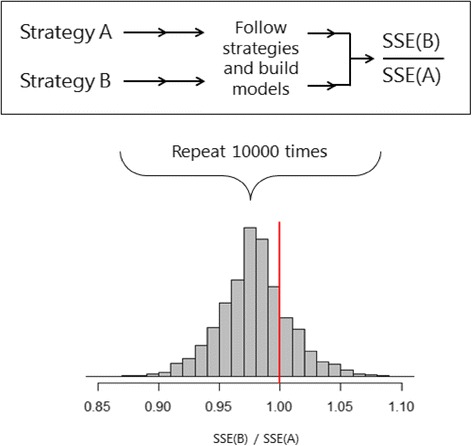
Background: It is often unclear which approach to fit, assess and adjust a model will yield the most accurate prediction model. We present an extension of an approach for comparing modelling strategies in linear regression to the setting of logistic regression and demonstrate its application in clinical prediction research.

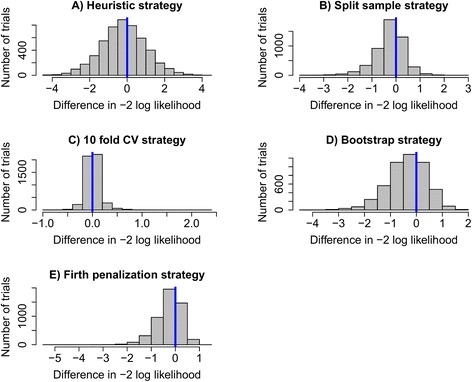
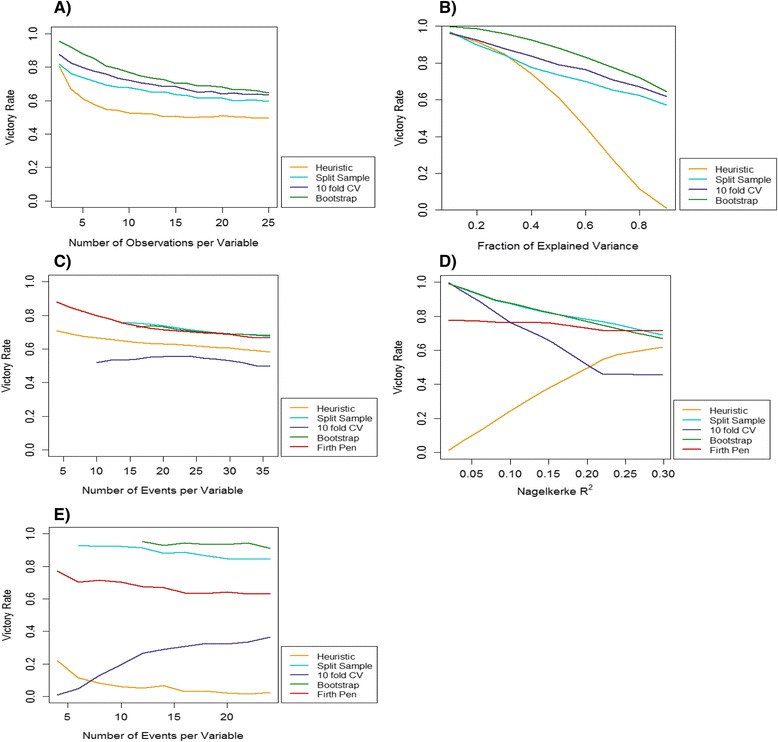
Methods: A framework for comparing logistic regression modelling strategies by their likelihoods was formulated using a wrapper approach. Five different strategies for modelling, including simple shrinkage methods, were compared in four empirical data sets to illustrate the concept of a priori strategy comparison. Simulations were performed in both randomly generated data and empirical data to investigate the influence of data characteristics on strategy performance. We applied the comparison framework in a case study setting. Optimal strategies were selected based on the results of a priori comparisons in a clinical data set and the performance of models built according to each strategy was assessed using the Brier score and calibration plots.

Results: The performance of modelling strategies was highly dependent on the characteristics of the development data in both linear and logistic regression settings. A priori comparisons in four empirical data sets found that no strategy consistently outperformed the others. The percentage of times that a model adjustment strategy outperformed a logistic model ranged from 3.9 to 94.9 %, depending on the strategy and data set. However, in our case study setting the a priori selection of optimal methods did not result in detectable improvement in model performance when assessed in an external data set.

Conclusion: The performance of prediction modelling strategies is a data-dependent process and can be highly variable between data sets within the same clinical domain. A priori strategy comparison can be used to determine an optimal logistic regression modelling strategy for a given data set before selecting a final modelling approach.


Figures

Fig. 1
Fig. 1
An example of the comparison of two linear regression modelling strategies. Strategies A and B are individually applied to a data set and the ratio SSE(B)/SSE(A) is calculated. The process is repeated 10,000 times yielding a comparison distribution. The left tail below a cut off value of 1 represents the victory rate of strategy B over strategy A, the proportion of times strategy B outperformed strategy A
Fig. 2
Fig. 2
Histograms of the distributions resulting from comparisons between five modelling strategies and the null strategy in the full Oudega data set. The victory rate of each strategy over the null strategy is represented by the proportion of trials to the left of the blue indicator line. The distributions each represent 5000 comparison replicates
Fig. 3
Fig. 3
a-e The influence of data characteristics on the performance of different modelling strategies compared to the null strategy. Victory rates were estimated across a range of values of a data parameter, keeping all other parameters fixed. a Linear regression using simulated data; the number of observations in the data per model variable was varied. b Linear regression using simulated data; the fraction of explained variance (R2) of the least squares model was varied. c Logistic regression using simulated data based on the full Oudega data; the number of outcome events in the data per model variable was varied. d Logistic regression using simulated data based on the full Oudega data; the explained variance (Nagelkerke’s R2) of the maximum likelihood model was varied. e Logistic regression using simulated data based on the Deepvein data; the number of outcome events in the data per model variable was varied. * A loess smoother was applied to (c), (d) and (e)

References

    1. Hemingway H, Croft P, Perel P, Hayden JA, Abrams K, Timmis A, et al. Prognosis research strategy (PROGRESS) 1: a framework for researching clinical outcomes. BMJ. 2013;346:e5595. doi: 10.1136/bmj.e5595. - DOI - PMC - PubMed
    1. Steyerberg EW, Moons KG, van der Windt DA, Hayden JA, Perel P, Schroter S, et al. Prognosis Research Strategy (PROGRESS) 3: prognostic model research. PLoS Med. 2013;10(2):e1001381. doi: 10.1371/journal.pmed.1001381. - DOI - PMC - PubMed
    1. Moons KG, Grobbee DE. Diagnostic studies as multivariable, prediction research. J Epidemiol Community Health. 2002;56(5):337–338. doi: 10.1136/jech.56.5.337. - DOI - PMC - PubMed
    1. Wasson JH, Sox HC, Neff RK, Goldman L. Clinical prediction rules. Applications and methodological standards. N Engl J Med. 1985;313(13):793–799. doi: 10.1056/NEJM198509263131306. - DOI - PubMed
    1. Harrell FE, Jr, Lee KL, Mark DB. Multivariable prognostic models: issues in developing models, evaluating assumptions and adequacy, and measuring and reducing errors. Stat Med. 1996;15(4):361–387. doi: 10.1002/(SICI)1097-0258(19960229)15:4<361::AID-SIM168>3.0.CO;2-4. - DOI - PubMed

LinkOut - more resources