

Characterization of transcription factor response kinetics in parallel
- PMID: 27557669
- PMCID: PMC4997724
- DOI: 10.1186/s12896-016-0293-6
Characterization of transcription factor response kinetics in parallel
Abstract
Background: Transcription factors (TFs) are effectors of cell signaling pathways that regulate gene expression. TF networks are highly interconnected; one signal can lead to changes in many TF levels, and one TF level can be changed by many different signals. TF regulation is central to normal cell function, with altered TF function being implicated in many disease conditions. Thus, measuring TF levels in parallel, and over time, is crucial for understanding the impact of stimuli on regulatory networks and on diseases.
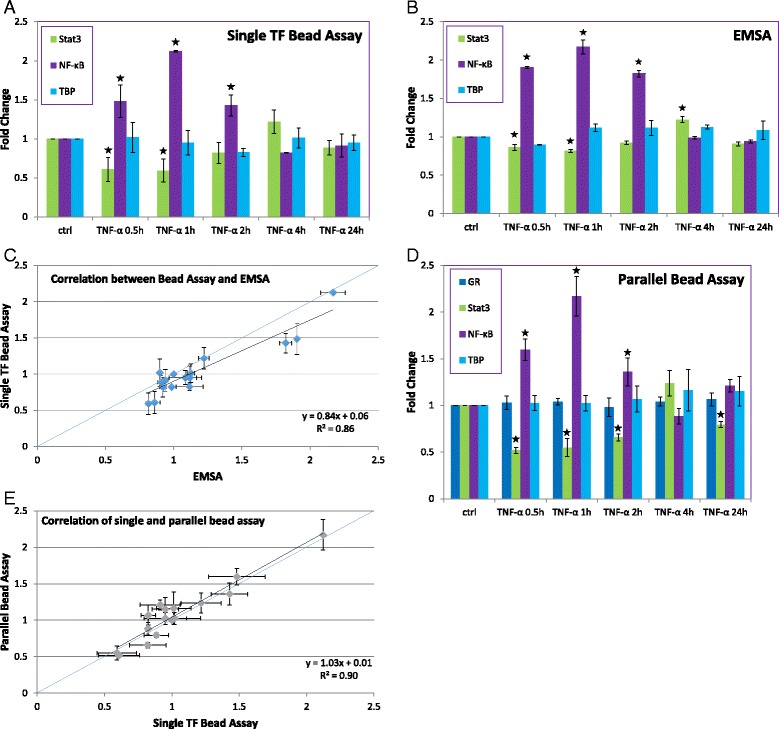
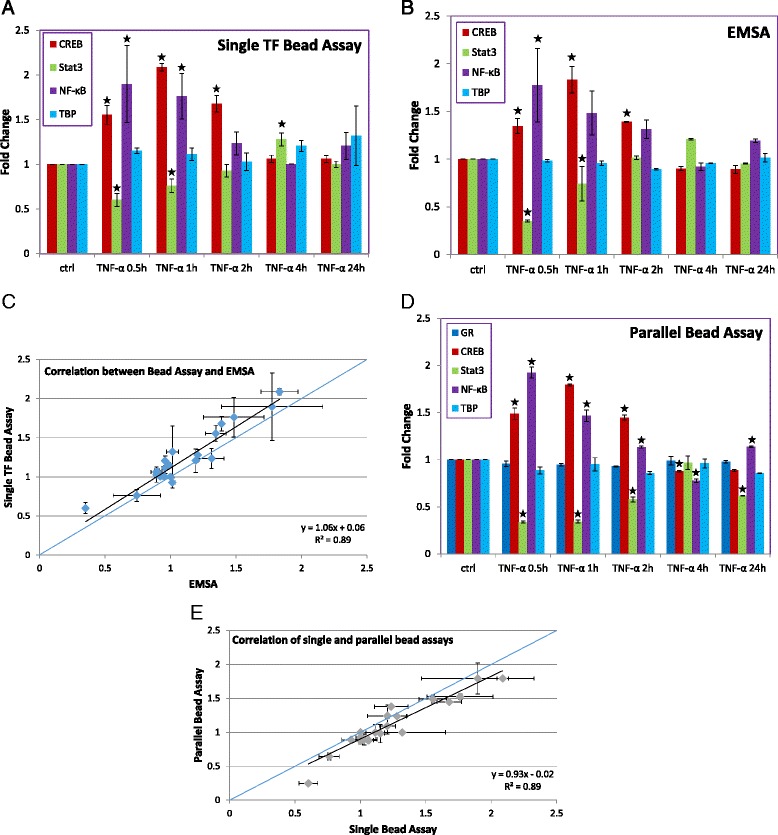
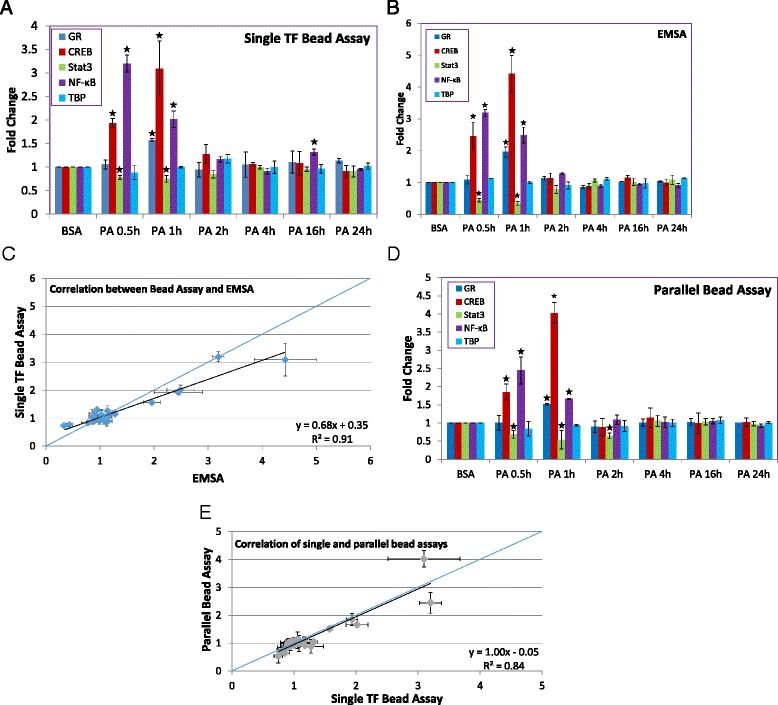
Results: Here, we report the parallel analysis of temporal TF level changes due to multiple stimuli in distinct cell types. We have analyzed short-term dynamic changes in the levels of nuclear factor kappa-light-chain-enhancer of activated B cells (NF-kB), signal transducer and activator of transcription 3 (Stat3), cAMP response element-binding protein (CREB), glucocorticoid receptor (GR), and TATA binding protein (TBP), in breast and liver cancer cells after tumor necrosis factor-alpha (TNF-α) and palmitic acid (PA) exposure. In response to both stimuli, NF-kB and CREB levels were increased, Stat3 decreased, and TBP was constant. GR levels were unchanged in response to TNF-α stimulation and increased in response to PA treatment.
Conclusions: Our results show significant overlap in signaling initiated by TNF-α and by PA, with the exception that the events leading to PA-mediated cytotoxicity likely also include induction of GR signaling. These results further illuminate the dynamics of TF responses to cytokine and fatty acid exposure, while concomitantly demonstrating the utility of parallel TF measurement approaches in the analysis of biological phenomena.
Keywords: HepG2 cells; Kinetics; MDA-MB-231 cells; Palmitic acid treatment; Parallel; Transcription factors.
Figures
Similar articles
-
How glucocorticoid receptors modulate the activity of other transcription factors: a scope beyond tethering.Mol Cell Endocrinol. 2013 Nov 5;380(1-2):41-54. doi: 10.1016/j.mce.2012.12.014. Epub 2012 Dec 23. Mol Cell Endocrinol. 2013. PMID: 23267834 Review.
-
Specificity, diversity, and convergence in VEGF and TNF-alpha signaling events leading to tissue factor up-regulation via EGR-1 in endothelial cells.FASEB J. 2001 Jan;15(1):230-242. doi: 10.1096/fj.00-0247com. FASEB J. 2001. PMID: 11149911
-
Feedback enrichment analysis for transcription factor-target genes in signaling pathways.Biosystems. 2020 Dec;198:104262. doi: 10.1016/j.biosystems.2020.104262. Epub 2020 Sep 28. Biosystems. 2020. PMID: 33002527
-
Vasoactive intestinal peptide and pituitary adenylate cyclase-activating polypeptide inhibit nuclear factor-kappa B-dependent gene activation at multiple levels in the human monocytic cell line THP-1.J Biol Chem. 2001 Jan 5;276(1):369-80. doi: 10.1074/jbc.M006923200. J Biol Chem. 2001. PMID: 11029467
-
Regulation of the MIR155 host gene in physiological and pathological processes.Gene. 2013 Dec 10;532(1):1-12. doi: 10.1016/j.gene.2012.12.009. Epub 2012 Dec 14. Gene. 2013. PMID: 23246696 Review.
Cited by
-
High-efficiency expression and secretion of human FGF21 in Bacillus subtilis by intercalation of a mini-cistron cassette and combinatorial optimization of cell regulatory components.Microb Cell Fact. 2019 Jan 28;18(1):17. doi: 10.1186/s12934-019-1066-4. Microb Cell Fact. 2019. PMID: 30691455 Free PMC article.
-
Involvement of cecropin B in the formation of the Aedes aegypti mosquito cuticle.Sci Rep. 2017 Nov 27;7(1):16395. doi: 10.1038/s41598-017-16625-6. Sci Rep. 2017. PMID: 29180688 Free PMC article.
References
-
- Al-Quobaili F, Montenarh M. Pancreatic duodenal homeobox factor-1 and diabetes mellitus type 2 (review) Int J Mol Med. 2008;21(4):399–404. - PubMed
-
- Maestro MA, Cardalda C, Boj SF, Luco RF, Servitja JM, Ferrer J. Distinct roles of HNF1beta, HNF1alpha, and HNF4alpha in regulating pancreas development, beta-cell function and growth. Endocr Dev. 2007;12:33–45. - PubMed
Publication types
MeSH terms
Substances
Grants and funding
LinkOut - more resources
Full Text Sources
Other Literature Sources
Miscellaneous
