. 2017 Apr;91(4):1957-1975.
doi: 10.1007/s00204-016-1808-6. Epub 2016 Aug 24.

Impact of genetic modulation of SULT1A enzymes on DNA adduct formation by aristolochic acids and 3-nitrobenzanthrone

Affiliations

Impact of genetic modulation of SULT1A enzymes on DNA adduct formation by aristolochic acids and 3-nitrobenzanthrone

Volker M Arlt et al. Arch Toxicol. 2017 Apr.

Abstract

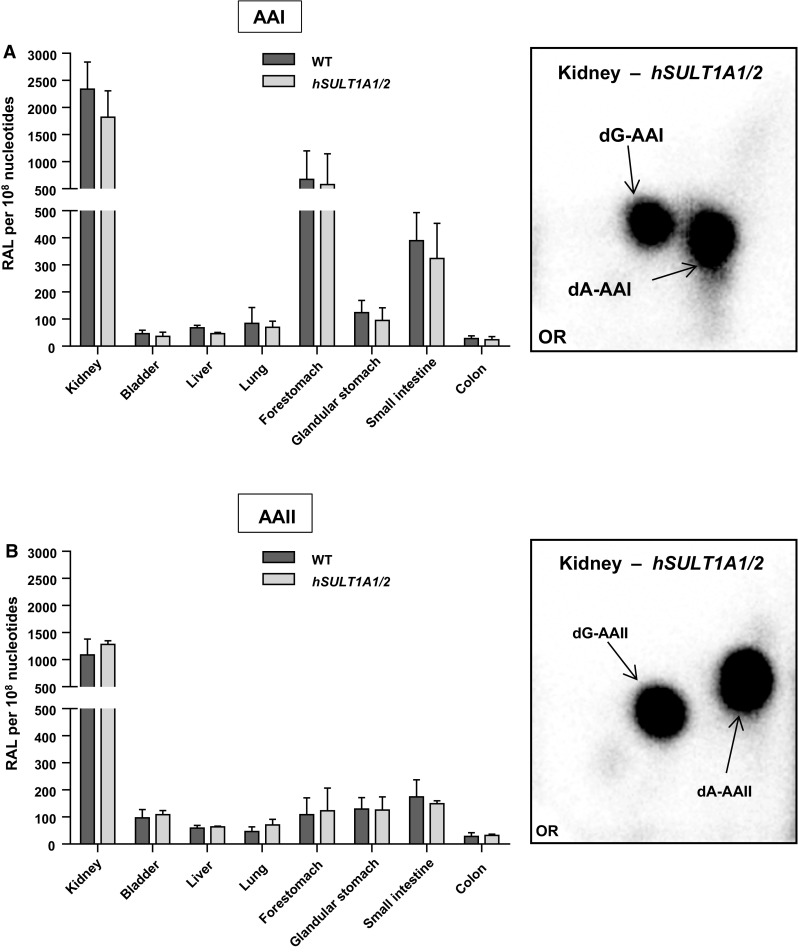
Exposure to aristolochic acid (AA) causes aristolochic acid nephropathy (AAN) and Balkan endemic nephropathy (BEN). Conflicting results have been found for the role of human sulfotransferase 1A1 (SULT1A1) contributing to the metabolic activation of aristolochic acid I (AAI) in vitro. We evaluated the role of human SULT1A1 in AA bioactivation in vivo after treatment of transgenic mice carrying a functional human SULT1A1-SULT1A2 gene cluster (i.e. hSULT1A1/2 mice) and Sult1a1(-/-) mice with AAI and aristolochic acid II (AAII). Both compounds formed characteristic DNA adducts in the intact mouse and in cytosolic incubations in vitro. However, we did not find differences in AAI-/AAII-DNA adduct levels between hSULT1A1/2 and wild-type (WT) mice in all tissues analysed including kidney and liver despite strong enhancement of sulfotransferase activity in both kidney and liver of hSULT1A1/2 mice relative to WT, kidney and liver being major organs involved in AA metabolism. In contrast, DNA adduct formation was strongly increased in hSULT1A1/2 mice compared to WT after treatment with 3-nitrobenzanthrone (3-NBA), another carcinogenic aromatic nitro compound where human SULT1A1/2 is known to contribute to genotoxicity. We found no differences in AAI-/AAII-DNA adduct formation in Sult1a1(-/-) and WT mice in vivo. Using renal and hepatic cytosolic fractions of hSULT1A1/2, Sult1a1(-/-) and WT mice, we investigated AAI-DNA adduct formation in vitro but failed to find a contribution of human SULT1A1/2 or murine Sult1a1 to AAI bioactivation. Our results indicate that sulfo-conjugation catalysed by human SULT1A1 does not play a role in the activation pathways of AAI and AAII in vivo, but is important in 3-NBA bioactivation.

Keywords: 3-Nitrobenzanthrone; Aristolochic acid nephropathy; Balkan endemic nephropathy; Carcinogen metabolism; DNA adducts; Sulfotransferase 1A1.


Figures

Fig. 1
Fig. 1
Proposed pathways of bioactivation and DNA adduct formation by AA (a) and 3-NBA (b). See text for details
Fig. 2
Fig. 2
Total DNA adduct levels measured by the nuclease P1 enrichment version of the 32P-postlabelling method in various organs of WT and hSULT1A1/2 mice after exposure to a single oral dose of 50 mg/kg body weight AAI (a) or AAII (b). Values are the mean ± SD (n = 4 animals). Statistical analysis was performed by Student’s t test; no significant differences were observed between WT and hSULT1A1/2 mice. Inserts Autoradiograms of DNA adducts, measured by 32P-postlabelling, in kidney tissue of hSULT1A1/2 mice. These profiles are representative of adduct pattern obtained with DNA from other mouse tissues including bladder, liver, lung, forestomach, glandular stomach, small intestine and colon, and those in WT mice. The origin (OR) on the TLC plate, at the bottom left-hand corners, was cut off before exposure. 7-(deoxyadenosin-N 6-yl)-aristolactam I (dA-AAI); 7-(deoxyguanosin-N 2-yl)-aristolactam I (dG-AAI); 7-(deoxyadenosin-N 6-yl)-aristolactam II (dA-AAII); 7-(deoxyguanosin-N 2-yl)-aristolactam II (dG-AAII)
Fig. 3
Fig. 3
Total DNA adduct levels measured in various organs of WT and hSULT1A1/2 mice after exposure to a single i.p. dose of 2 mg/kg body weight 3-NBA. DNA adduct formation was determined by the butanol-enrichment version of the 32P-postlabelling method. Values are the mean ± SD (n = 3 animals). F, fold difference in DNA binding relative to WT mice. Statistical analysis was performed by Student’s t test (*P < 0.05, **P < 0.01, ***P < 0.001; different from WT mice). Insert Autoradiogram of DNA adducts, measured by 32P-postlabelling, in kidney tissue of hSULT1A1/2 mice. These profiles are representative of adduct pattern obtained with DNA from other mouse tissues including bladder, liver, lung, forestomach, glandular stomach, small intestine and colon, and those in WT mice. The origin (OR) on the TLC plate, at the bottom left-hand corners, was cut off before exposure. Spot 1, 2-(2′-deoxyadenosin-N 6-yl)-3-aminobenzanthrone (dA-N 6-3-ABA); spot 2, as-yet-uncharacterised deoxyadenosine adduct; spot 3, 2-(2′-deoxyguanosin-N 2-yl)-3-aminobenzanthrone (dG-N 2-3-ABA); and spot 4, N-(2′-deoxyguanosin-8-yl)-3-aminobenzanthrone (dG-C8-N-3-ABA)
Fig. 4
Fig. 4
a Western blot analysis of human SULT1A1/2 and murine Nqo1 protein expression in whole tissue lysates isolated from WT and hSULT1A1/2 mice after exposure to a single oral dose of 50 mg/kg body weight AAI or AAII. b Western blot analysis of murine Nqo1 protein expression in whole tissue lysates isolated from the kidney, liver and lung of WT and hSULT1A1/2 mice after exposure to AAI or AAII. Gapdh was used as loading control and representative blots are shown. CO colon, SI small intestine, GS glandular stomach, KI kidney, LI liver, LU lung, SPL spleen. Representative images of the Western blotting are shown, and at least duplicate analysis was performed from independent experiments
Fig. 5
Fig. 5
Total AAI-DNA adducts, as measured by the nuclease P1-enrichment version of the 32P-postlabelling method, formed ex vivo in renal (a, b) and hepatic cytosols (c, d) isolated from untreated, AAI- or AAII-pretreated WT and hSULT1A1/2 mice incubated with AAI and DNA in the absence (a and c) or presence of PAPS (b, d). Values are the mean ± range (n = 4; duplicate incubations and each sample was determined by two independent 32P-postlabelling analyses). Statistical analysis was performed by two-way ANOVA followed by Tukey’s multiple comparison test (*P < 0.05, **P < 0.01, ***P < 0.001—different from control WT mice; # P < 0.05, ### P < 0.001—different from control hSULT1A1/2 mice; §§ P < 0.01—different from incubation without PAPS). Inserts Representative autoradiograms of DNA adducts, measured by 32P-postlabelling, in AAI incubations with renal and hepatic cytosols. The origin (OR) on the TLC plate, at the bottom left-hand corners, was cut off before exposure. 7-(deoxyadenosine-N 6-yl)-aristolactam I (dA-AAI); 7-(deoxyguanosin-N 2-yl)-aristolactam I (dG-AAI); 7-(deoxyadenosine-N 6-yl)-aristolactam II (dA-AAII); 7-(deoxyguanosin-N 2-yl)-aristolactam II (dG-AAII)
Fig. 6
Fig. 6
Measurement of Nqo1 (a, c) and sulfotransferase (b, d) enzyme activity in cytosolic fractions of the kidneys (upper panels) and livers (lower panels) from untreated, AAI- or AAII-treated WT and hSULT1A1/2 mice. Nqo1 enzyme activity was determined using menadione and cytochrome c as substrate and expressed as nmol cytochrome c/min/mg protein. Sulfotransferase enzyme activity was determined using a colorimetric assay with p-nitrophenol sulfate as sulfo-donor and is expressed as nmol p-nitrophenol/min/mg protein. Values are the mean ± SD of three determinations. Statistical analysis was performed by two-way ANOVA followed by Tukey’s multiple comparison test (*P < 0.05, **P < 0.01, ***P < 0.001—different from control WT mice; ### P < 0.001—different from control hSULT1A1/2 mice)
Fig. 7
Fig. 7
Total DNA adduct levels measured by the nuclease P1 enrichment version of the 32P-postlabelling method in kidney (a, d), liver (b, e) and small intestine (c, f) of WT, Sult1a1(−/−) and Sult1d1(−/−) mice after exposure to a single oral dose of 50 mg/kg body weight AAI (ac) or AAII (df). Values are the mean ± SD (n = 4 animals). F, fold difference in DNA binding relative to WT mice. Statistical analysis was performed by one-way ANOVA followed by Tukey’s multiple comparison test (*P < 0.05—different from WT mice). Inserts Autoradiograms of DNA adducts, measured by 32P-postlabelling, in kidney tissue of Sult1a1(−/−) mice. These profiles are representative of adduct pattern obtained with DNA from liver and small intestine, and those in WT and Sult1d1(−/−) mice. The origin (OR) on the TLC plate, at the bottom left-hand corners, was cut off before exposure. 7-(deoxyadenosin-N 6-yl)-aristolactam I (dA-AAI); 7-(deoxyguanosin-N 2-yl)-aristolactam I (dG-AAI); 7-(deoxyadenosin-N 6-yl)-aristolactam II (dA-AAII); 7-(deoxyguanosin-N 2-yl)-aristolactam II (dG-AAII)
Fig. 8
Fig. 8
Total AAI-DNA adduct levels, as measured by the nuclease P1-enrichment version of the 32P-postlabelling method, formed ex vivo in renal (a) and hepatic cytosols (b) isolated from untreated, AAI- or AAII-pretreated WT, Sult1a1(−/−) and Sult1d1(−/−) mice incubated with AAI and DNA in the presence of PAPS. Values are the mean ± range (n = 4 analyses; duplicate incubations and each sample was determined by two independent 32P-postlabelling analyses). Statistical analysis was performed by two-way ANOVA followed by Tukey’s multiple comparison test (*P < 0.05, **P < 0.01, ***P < 0.001—different from control WT mice; ## P < 0.01, ### P < 0.001—different from control Sult1d1(−/−) mice). Inserts Representative autoradiograms of DNA adducts, measured by 32P-postlabelling, in AAI incubations with renal and hepatic cytosols. The origin (OR) on the TLC plate, at the bottom left-hand corners, was cut off before exposure. 7-(deoxyadenosine-N 6-yl-aristolactam I (dA-AAI); 7-(deoxyguanosin-N 2-yl-aristolactam I (dG-AAI); 7-(deoxyadenosine-N 6-yl-aristolactam II (dA-AAII); 7-(deoxyguanosin-N 2-yl-aristolactam II (dG-AAII)
Fig. 9
Fig. 9
Nqo1 enzyme activity in cytosolic fractions of the kidneys (a) and livers (b) from untreated, AAI- or AAII-treated WT, Sult1a1(−/−) and Sult1d1(−/−) using menadione and cytochrome c as substrate. Values are the mean ± SD of three determinations; Nqo1 enzyme activity is expressed as nmol cytochrome c/min/mg protein. Statistical analysis was performed by two-way ANOVA followed by Tukey’s multiple comparison test (*P < 0.05, **P < 0.01, ***P < 0.001—different from control WT mice; §§ P < 0.01, §§§ P < 0.001—different from control Sult1a1(−/−) mice; ## P < 0.01, ### P < 0.001—different from control Sult1d1(−/−) mice, respectively)
Fig. 10
Fig. 10
Total 3-NBA-DNA adduct levels, as measured by the butanol-enrichment version of the 32P-postlabelling method, formed in vitro in hepatic cytosols isolated from WT, Sult1a1(−/−) and Sult1d1(−/−) mice incubated with 3-NBA and DNA in the absence (a) or presence of PAPS (b). Values are the mean ± range (n = 4 analyses; duplicate incubations and each sample was determined by two independent 32P-postlabelling analyses). Statistical analysis was performed by two-way ANOVA followed by Tukey’s multiple comparison test (***P < 0.001—different from WT mice; §§§ P < 0.001—different from incubation without PAPS). Insert Representative autoradiogram of DNA adducts, measured by 32P-postlabelling, in AAI incubations with hepatic cytosols. The origin (OR) on the TLC plate, at the bottom left-hand corners, was cut off before exposure. Spot 1, 2-(2′-deoxyadenosin-N 6-yl)-3-aminobenzanthrone (dA-N 6-3-ABA); spot 2, as-yet uncharacterised deoxyadenosine adduct; spot 3, 2-(2′-deoxyguanosin-N 2-yl)-3-aminobenzanthrone (dG-N 2-3-ABA); and spot 4, N-(2′-deoxyguanosin-8-yl)-3-aminobenzanthrone (dG-C8-N-3-ABA)

References

    1. Alnouti Y, Klaassen CD. Tissue distribution and ontogeny of sulfotransferase enzymes in mice. Toxicol Sci. 2006;93(2):242–255. doi: 10.1093/toxsci/kfl050. - DOI - PubMed
    1. Arlt VM. 3-Nitrobenzanthrone, a potential human cancer hazard in diesel exhaust and urban air pollution: a review of the evidence. Mutagenesis. 2005;20(6):399–410. doi: 10.1093/mutage/gei057. - DOI - PubMed
    1. Arlt VM, Bieler CA, Mier W, Wiessler M, Schmeiser HH. DNA adduct formation by the ubiquitous environmental contaminant 3-nitrobenzanthrone in rats determined by (32)P-postlabeling. Int J Cancer. 2001;93(3):450–454. doi: 10.1002/ijc.1346. - DOI - PubMed
    1. Arlt VM, Ferluga D, Stiborova M, et al. Is aristolochic acid a risk factor for Balkan endemic nephropathy-associated urothelial cancer? Int J Cancer. 2002;101(5):500–502. doi: 10.1002/ijc.10602. - DOI - PubMed
    1. Arlt VM, Glatt H, Muckel E, et al. Metabolic activation of the environmental contaminant 3-nitrobenzanthrone by human acetyltransferases and sulfotransferase. Carcinogenesis. 2002;23(11):1937–1945. doi: 10.1093/carcin/23.11.1937. - DOI - PubMed

LinkOut - more resources