. 2016 Aug 24;17(1):178.
doi: 10.1186/s13059-016-1029-6.

MuSE: accounting for tumor heterogeneity using a sample-specific error model improves sensitivity and specificity in mutation calling from sequencing data

Affiliations

MuSE: accounting for tumor heterogeneity using a sample-specific error model improves sensitivity and specificity in mutation calling from sequencing data

Yu Fan et al. Genome Biol. .

Abstract

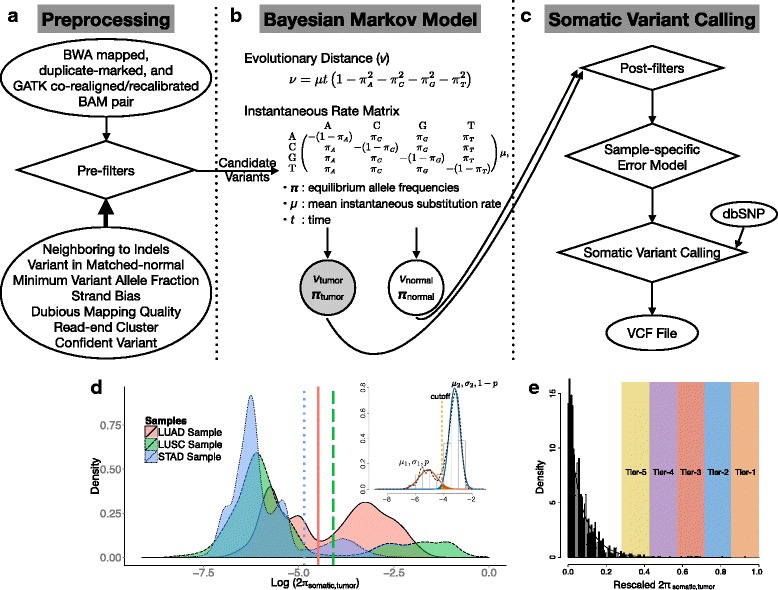
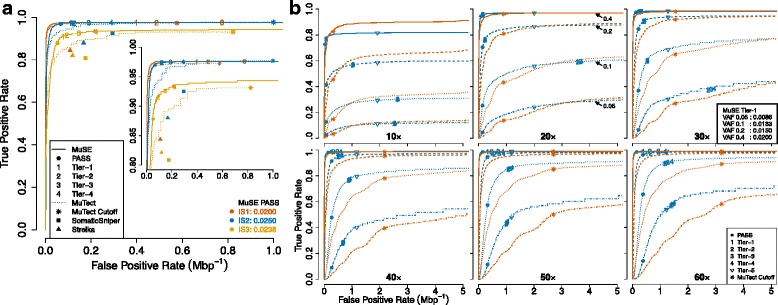
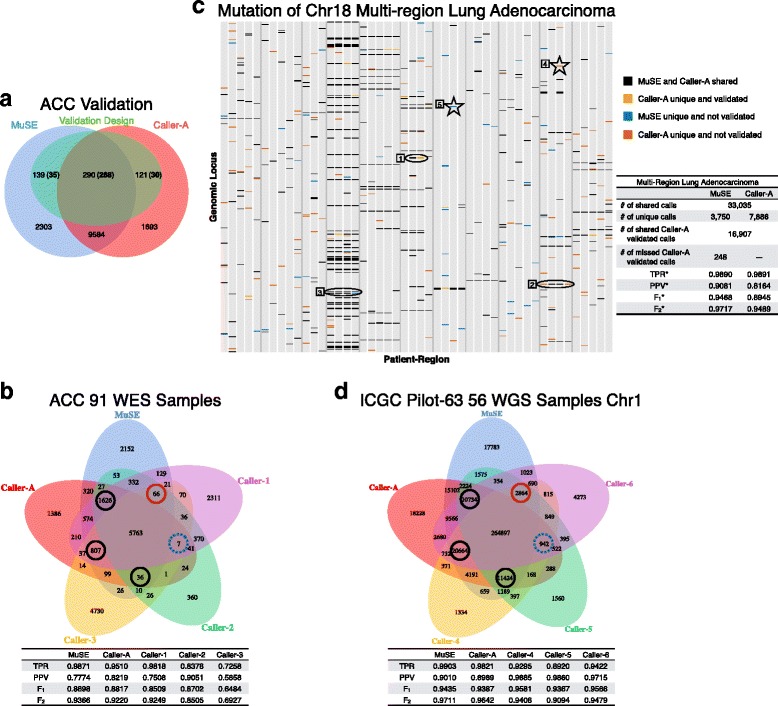
Subclonal mutations reveal important features of the genetic architecture of tumors. However, accurate detection of mutations in genetically heterogeneous tumor cell populations using next-generation sequencing remains challenging. We develop MuSE ( http://bioinformatics.mdanderson.org/main/MuSE ), Mutation calling using a Markov Substitution model for Evolution, a novel approach for modeling the evolution of the allelic composition of the tumor and normal tissue at each reference base. MuSE adopts a sample-specific error model that reflects the underlying tumor heterogeneity to greatly improve the overall accuracy. We demonstrate the accuracy of MuSE in calling subclonal mutations in the context of large-scale tumor sequencing projects using whole exome and whole genome sequencing.

Keywords: Bayesian inference; Model-based cutoff finding; Next-generation sequencing; Sensitivity and specificity; Somatic mutation calling.


Figures

Fig. 1
Fig. 1
Flowchart of the somatic point mutation caller MuSE. a MuSE takes as input the Burrows-Wheeler Aligner-aligned BAM sequence data from the pair of tumor and normal DNA samples. The BAM sequence data are processed by following the Genome Analysis Toolkit Best Practices. Next, at each genomic locus, MuSE applies seven heuristic pre-filters to screen out false positives resulting from correlated sequencing artifacts. b MuSE employs the F81 Markov substitution model of DNA sequence evolution to describe the evolution from the reference allele to the tumor and the normal allelic composition. It writes to an output file the MAP estimates of four allele equilibrium frequencies (π) and the evolutionary distance (ν). c MuSE uses the MAP estimates of π to compute the tier-based cutoffs by building a sample-specific error model. MuSE deploys two different methods of building the sample-specific error model for the respective WES data and WGS data. Besides using the sample-specific error model, MuSE takes into account the dbSNP information by requiring a more stringent cutoff for a dbSNP position than for a non-dbSNP position. The final output is a Variant Call Format file that lists all the identified somatic variants. d Illustration of the sample-specific error model for WGS data. Tumor heterogeneity is illustrated using TCGA lung adenocarcinoma (LUAD), lung squamous cell carcinoma (LUSC), and stomach adenocarcinoma (STAD) WGS data. All π somatic selected for building the sample-specific error models are used to draw the densities that are on the logarithmic scale. At the top right, we show a two-component Gaussian mixture distribution with means μ 1 and μ 2, standard deviations σ 1 and σ 2, and weights p and 1−p, for true negative and true positive, respectively. The expected false positive probability caused by the identified cutoff is the area labeled in red (on the right side of the cutoff), and the false negative probability is the area labeled in blue (on the left side of the cutoff). We first identify a cutoff that minimizes the sum of the two probabilities and add tiered cutoffs that are less stringent than the first one. e Illustration of the sample-specific error model for WES data. Selected π somatic are rescaled to fit a beta distribution. Tiers 1 to 5 are labeled for illustration purposes, but not in equal proportion to those in the real data
Fig. 2
Fig. 2
Comparison of sensitivity and specificity of MuSE and MuTect using synthetic data. a Comparison of sensitivity and specificity of MuSE (solid line), MuTect (dotted line), SomaticSniper (solid square), and Strelka (solid triangle) using the synthetic data IS1, IS2, and IS3 from the ICGC-TCGA DREAM Mutation Calling challenge. The numbers of positions with positive conditions are 3535, 4322, and 7903, respectively. Both tumor and matched-normal data have ∼ 30× average coverage. The three synthetic data sets are color-coded using red, blue, and orange, respectively, and the associated ROC curves, focusing on an FPR between 0 and 1×10⁻⁶, are ordered from top left to bottom right. The tier-based sample-specific cutoffs of MuSE and the MuTect default cutoff are labeled correspondingly. The embedded plot focuses on a narrow range of true positive rates. The two times when PASS cutoffs were identified are listed at the bottom right corner. Sensitivity and specificity of VarScan2 (not plotted because they were out of bounds) were 0.9859 and 8.369×10⁻⁶ (IS1), 0.9704 and 1.294×10⁻⁶ (IS2), and 0.8602 and 1.478×10⁻⁶ (IS3), respectively. b Comparison of sensitivity and specificity of MuSE (blue line) and MuTect (red line) using the virtual-tumor benchmarking approach. The ROC curves focus on an FPR between 0 and 5×10⁻⁶. Tumor sample sequencing depth varies from 10× to 60×, and matched-normal sample sequencing depth is fixed at 30×. Four scenarios of spike-in VAF 0.05 (dot-dashed), 0.1 (dotted), 0.2 (dashed), and 0.4 (solid) are plotted for every sequencing depth. The tier-based sample-specific cutoffs of MuSE and the MuTect default cutoff are labeled accordingly. Some MuSE cutoffs are close to each other and overlap on the plot. For 30× coverage, the two times that Tier 1 cutoffs were identified are listed at the bottom right corner of the corresponding subplot
Fig. 3
Fig. 3
MuSE performance in two WES data sets and one WGS data set. a Venn diagram of MuSE and Caller A calls from 91 pairs of ACC WES samples. The calls are overlaid with 550 positions that were selected for deep sequencing validation. The numbers of validated calls are shown in boldface. For selected MuSE unique, MuSE and Caller A shared, and Caller A unique calls, 35 out of 139, 268 out of 290, and 30 out of 121 are validated, respectively. b Venn diagram of calls from five different callers using the same ACC data. All the calls except those of MuSE are extracted from TCGA mutation annotation format (MAF) file. The circles label the numbers of calls missed by one caller but captured by the other four callers. The blue dotted circle denotes the number of calls missed by MuSE, and the red solid circle indicates the number of calls missed by Caller A. TPR, PPV, F1, and F2 scores are calculated and listed below the Venn diagram. The truth set is defined as calls shared by at least three callers. c Mutation plot and summary table of MuSE and Caller A calls from 48 pairs of multi-region lung adenocarcinoma WES samples. Each gray column represents a sample. MuSE and Caller A share 33,035 calls and possess 3750 and 7886 unique calls, respectively. Only calls from Caller A were further validated. MuSE confirms 16,907 and misses 248 Caller A validated calls. Calls from chromosome 18 are shown in the mutation plot to illustrate how the artificial truth set and false positives are defined. The vertical gray lines separate 11 patients who have samples from 3 to 5 regions of one tumor. The numbered shapes combined with different call types are examples for defining the artificial truth set as positions that fall into any of the three categories: shared or validated (oval 1), called in all regions by including Caller A unique (oval 2), called in all regions by including MuSE unique (oval 3), and false positives: unique and single calls (star 4 and star 5). Correspondingly, the TPR, PPV, F1, and F2 scores are calculated and listed beside the mutation plot. d Venn diagram of calls from five different callers using 56 pairs of ICGC Pilot-63 WGS samples on chromosome 1. The circles label the number of calls missed by one caller but captured by the other four callers. The blue dotted circle denotes the number of calls missed by MuSE, and the red solid circle indicates the number of calls missed by Caller A. TPR, PPV, F1, and F2 scores are calculated and listed below the Venn diagram

References

    1. Koboldt DC, Zhang Q, Larson DE, Shen D, McLellan MD, Lin L, et al. VarScan 2: somatic mutation and copy number alteration discovery in cancer by exome sequencing. Genome Res. 2012;22(3):568–76. doi: 10.1101/gr.129684.111. - DOI - PMC - PubMed
    1. Reumers J, De Rijk P, Zhao H, Liekens A, Smeets D, Cleary J, et al. Optimized filtering reduces the error rate in detecting genomic variants by short-read sequencing. Nat Biotechnol. 2012;30(1):61–8. doi: 10.1038/nbt.2053. - DOI - PubMed
    1. Roth A, Ding J, Morin R, Crisan A, Ha G, Giuliany R, et al. JointSNVMix: a probabilistic model for accurate detection of somatic mutations in normal/tumour paired next-generation sequencing data. Bioinformatics (Oxford, England) 2012;28(7):907–13. doi: 10.1093/bioinformatics/bts053. - DOI - PMC - PubMed
    1. Saunders CT, Wong WSW, Swamy S, Becq J, Murray LJ, Cheetham RK. Strelka: accurate somatic small-variant calling from sequenced tumor-normal sample pairs. Bioinformatics (Oxford, England) 2012;28(14):1811–7. doi: 10.1093/bioinformatics/bts271. - DOI - PubMed
    1. Cibulskis K, Lawrence MS, Carter SL, Sivachenko A, Jaffe D, Sougnez C, et al. Sensitive detection of somatic point mutations in impure and heterogeneous cancer samples. Nat Biotechnol. 2013;31(3):213–9. doi: 10.1038/nbt.2514. - DOI - PMC - PubMed

Publication types