. 2016 Aug 25;7(1):122.
doi: 10.1186/s13287-016-0383-3.

Potency testing of mesenchymal stromal cell growth expanded in human platelet lysate from different human tissues

Affiliations

Potency testing of mesenchymal stromal cell growth expanded in human platelet lysate from different human tissues

R Fazzina et al. Stem Cell Res Ther. .

Abstract

Background: Mesenchymal stromal cells (MSCs) have been largely investigated, in the past decade, as potential therapeutic strategies for various acute and chronic pathological conditions. MSCs isolated from different sources, such as bone marrow (BM), umbilical cord tissue (UCT) and adipose tissue (AT), share many biological features, although they may show some differences on cumulative yield, proliferative ability and differentiation potential. The standardization of MSCs growth and their functional amplification is a mandatory objective of cell therapies. The aim of this study was to evaluate the cumulative yield and the ex vivo amplification potential of MSCs obtained from various sources and different subjects, using defined culture conditions with a standardized platelet lysate (PL) as growth stimulus.

Methods: MSCs isolated from BM, UCT and AT and expanded in human PL were compared in terms of cumulative yield and growth potential per gram of starting tissue. MSCs morphology, phenotype, differentiation potential, and immunomodulatory properties were also investigated to evaluate their biological characteristics.

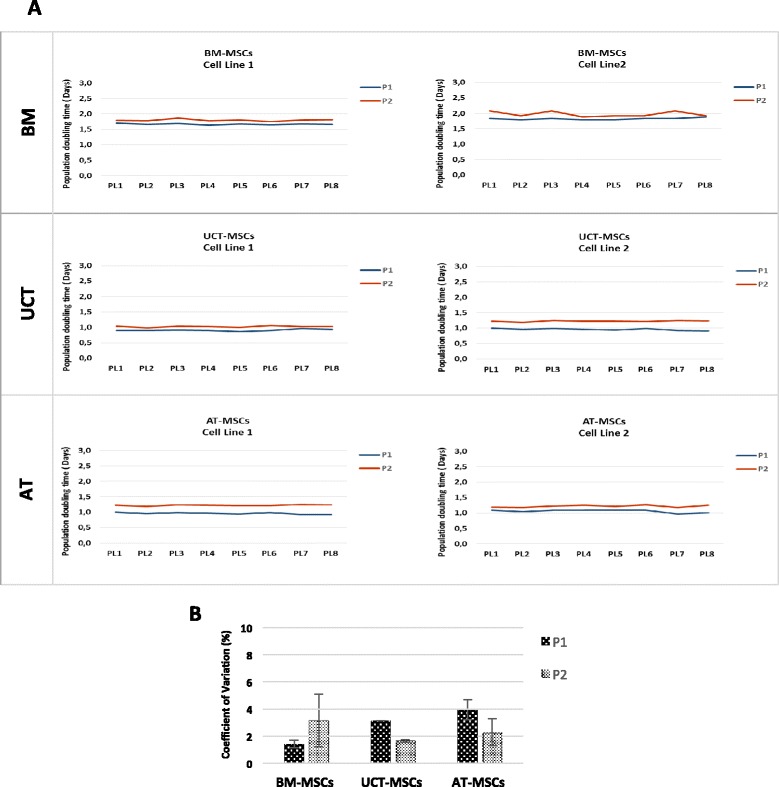
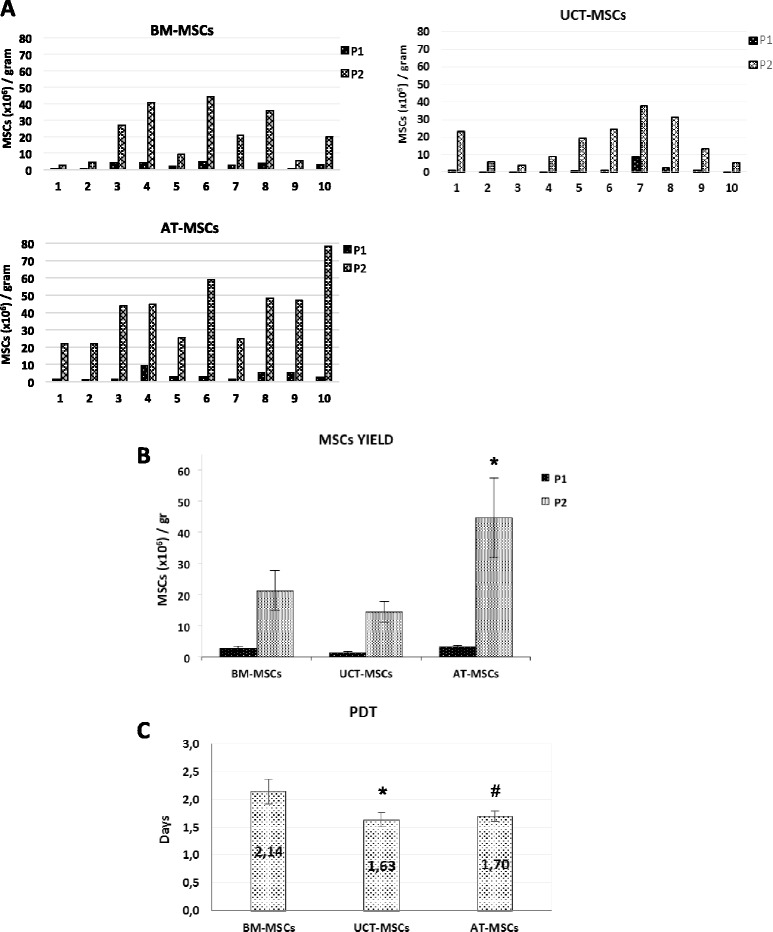
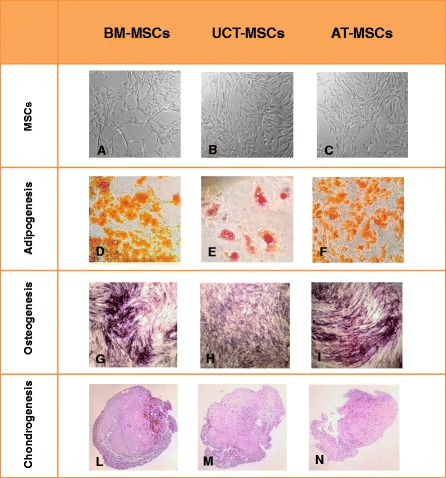
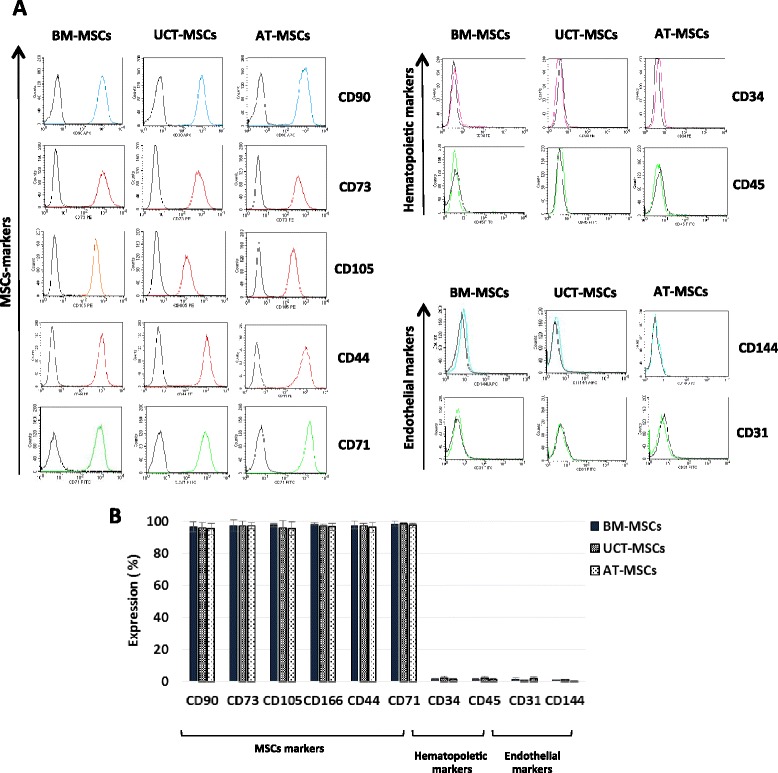
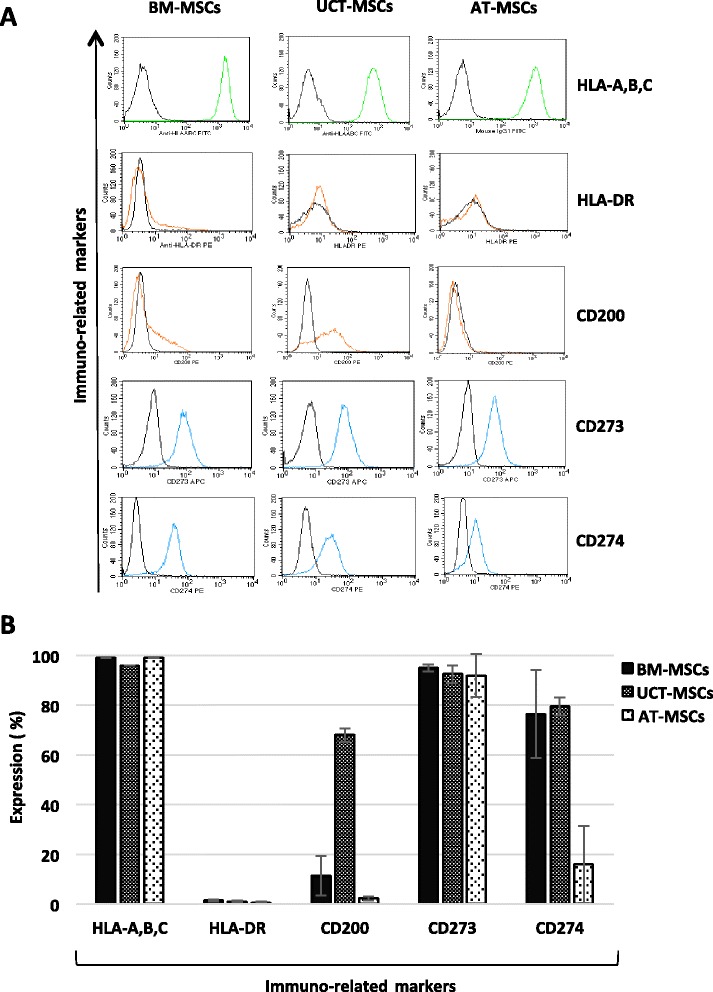
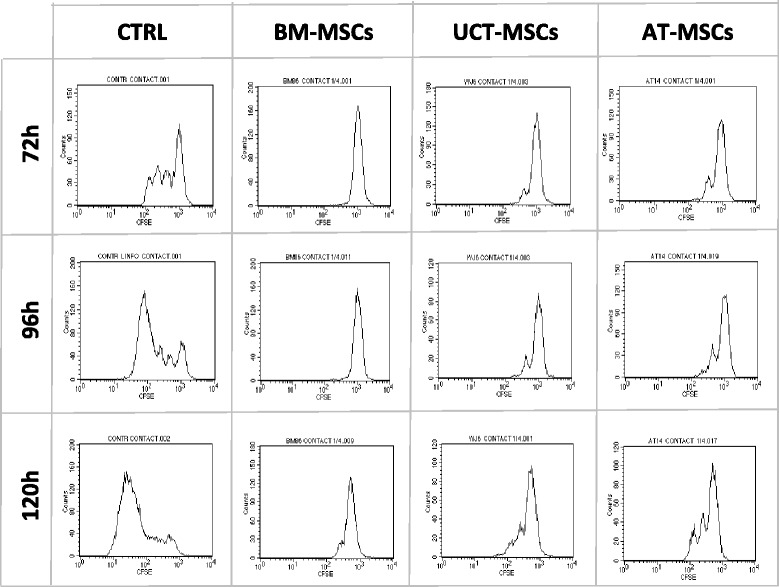
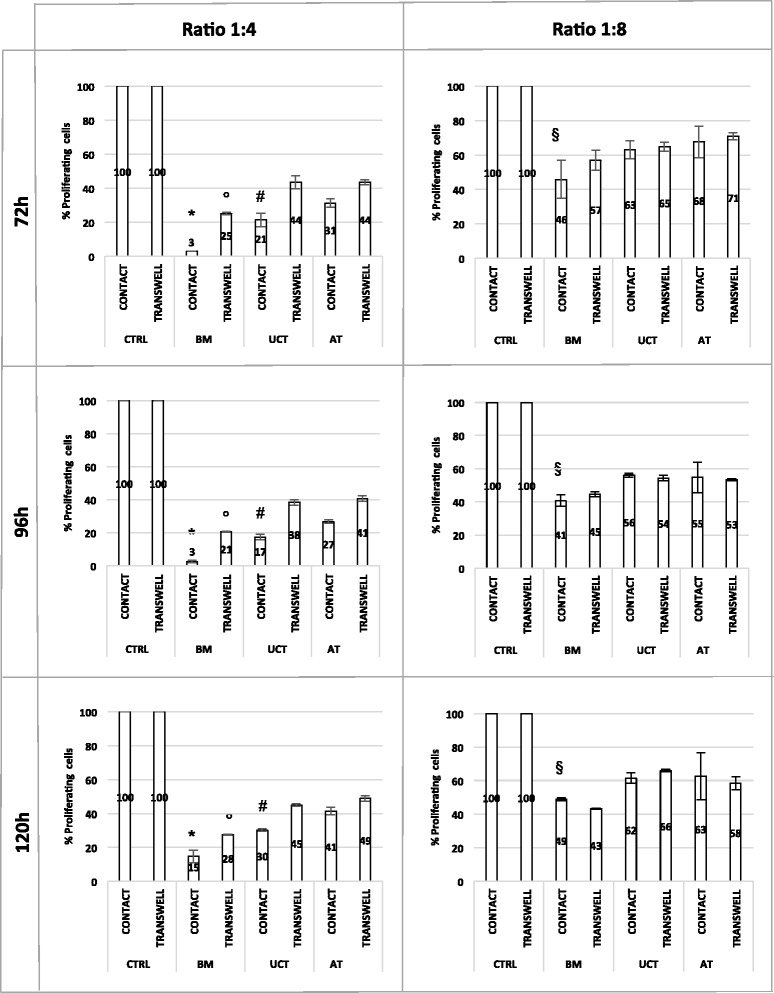
Results: The use of standardized PL-based culture conditions resulted in a very low variability of MSC growth. Our data showed that AT has the greater capacity to generate MSC per gram of initial tissue, compared to BM and UCT. However, UCT-MSCs replicated faster than AT-MSCs and BM-MSCs, revealing a greater proliferation capacity of this source irrespective of its lower MSC yield. All MSCs exhibited the typical MSC phenotype and the ability to differentiate into all mesodermal lineages, while BM-MSCs showed the most prominent immunosuppressive effect in vitro.

Conclusions: The adoption of standardized culture conditions may help researchers and clinicians to reveal particular characteristics and inter-individual variability of MSCs sourced from different tissues. These data will be beneficial to set the standards for tissue collection and MSCs clinical-scale expansion both for cell banking and for cell-based therapy settings.

Keywords: Adipose tissue; Bone marrow; Culture standardization; Mesenchymal stromal cells; Platelet lysate; Proliferative potential; Umbilical cord tissue.


Figures

Fig. 1
Fig. 1
Platelet lysate lot testing. a MSCs growth assay with different platelet lysate lots. Two MSCs cell lines for each source (BM, UCT, AT) were used to test the growth promotion ability and variability of eight different PL lots (PL1–PL8). MSCs proliferation was evaluated at passage 1 (P1) and passage 2 (P2). b Coefficient of variation percentage related to the eight different PL lots (PL1–PL8) in BM-MSCs, UCT-MSCs, and AT-MSCs cultures at P1 and P2. Results are expressed as mean ± SD (standard deviation). (F = 0.479 and p = 0.847 at ANOVA and p > 0.900 for any post hoc comparison at Scheffe test) AT adipose tissue, BM bone marrow, MSCs mesenchymal stromal cells, UCT umbilical cord tissue
Fig. 2
Fig. 2
Expansion potential of MSCs from BM, UCT and AT. a The expansion of MSCs from ten samples of each source (BM, UCT, AT) revealed a high inter-individual variability in the amount of MSCs obtained per gram of initial tissue, which ranged between 2 × 106 and 80 × 106 at Passage 2 (P2). b Comparison of the average of MSCs cumulative cell yield per gram of initial tissue (BM, UCT, AT) at Passage 1 (P1) and P2. Results were represented as mean ± SEM (standard error of the mean) (F = 19.712 and p < 0.000 at ANOVA; *p = 0.008 for AT vs BM and p = 0.001 for AT vs UCT at Scheffe test). c Comparison of the population doubling time (PTD) mean calculated at P1 and P2 of MSCs populations derived from the different tissues. Data are shown as means ± SD of ten samples processed for each tissue (F = 3.960 and p = 0.002 at ANOVA and *p = 0.042 for UCT vs BM and # p = 0.050 for AT vs BM at Scheffe test for P2). AT adipose tissue, BM bone marrow, MSCs mesenchymal stromal cells, UCT umbilical cord tissue
Fig. 3
Fig. 3
Morphology and differentiation assays of MSCs. Spindle-shaped adherent cells with MSCs morphology were observed in BM-MSCs (a), UCT-MSCs (b) and AT-MSCs (c) cultures. Representative images of BM-MSCs, UCT-MSCs and AT-MSCs induced to differentiate into adipogenic (d-f), osteogenic (g-i), and chondrogenic lineages (l-n). (Magnification × 100). AT adipose tissue, BM bone marrow, MSCs mesenchymal stromal cells, UCT umbilical cord tissue
Fig. 4
Fig. 4
Flow cytometric analysis of MSCs phenotype. a Histograms showing the MSCs, hematopoietic and endothelial surface antigen expression of BM-MSCs, UCT-MSCs and AT-MSCs. One representative MSC sample for each source is shown. b Quantitative expression of MSCs, hematopoietic and endothelial antigens measured by flow cytometry. Results are expressed as mean ± SD (standard deviation) of ten samples processed for each tissue. AT adipose tissue, BM bone marrow, MSCs mesenchymal stromal cells, UCT umbilical cord tissue
Fig. 5
Fig. 5
Immune-related markers. a Histograms showing the immune-related antigen expression of BM-MSCs, UCT-MSCs and AT-MSCs. One representative MSC sample for each source is shown. b Quantitative expression of immune-related markers measured by flow cytometry. Results are expressed as mean ± SD (standard deviation) of five samples processed for each tissue. AT adipose tissue, BM bone marrow, MSCs mesenchymal stromal cells, UCT umbilical cord tissue
Fig. 6
Fig. 6
CFSE dilution profile in CFSE-based lymphocyte proliferation assay. Histograms representing the distribution of proliferating lymphocytes with respect to CFSE expression level. When labelled cells undergo cell division, the CFSE fluorescence intensity is reduced by 50 %, generating new peaks on the left side of the initial peak of dye intensity. CFSE dilution profiles of total proliferating lymphocytes at 72 h, 96 h and 120 h in the absence (CTRL) or in the presence of BM-MSCs, UCT-MSCs and AT-MSCs are shown. AT adipose tissue, BM bone marrow, CTRL control, MSCs mesenchymal stromal cells, UCT umbilical cord tissue
Fig. 7
Fig. 7
MSC immunosuppressive effect on lymphocyte proliferation. Data show the percentages of residual proliferative capacity of stimulated lymphocytes in the absence (CTRL) or in the presence of BM-MSCs, UCT-MSCs and AT-MSCs at ratio 1:4 and 1:8 (MSCs:PBMCs), either in cell-cell contact or in transwell system, evaluated at 72 h, 96 h and 120 h. (F = 29.025 and p = 0.000 at ANOVA and * p = 0.000 for BM vs AT, * p = 0.001 for BM vs UCT, # p = 0.029 for AT vs UCT at Scheffe test for 1:4 ratio in contact cultures; F = 53.301 and p = 0.000 at ANOVA and °p = 0.000 for BM vs AT, °p = 0.001 for BM vs UCT, p = 0.237 for AT vs UCT at Scheffe test for 1:4 ratio for transwell cultures; F = 6.57 and p = 0.008 at ANOVA and p = 0.152 for BM vs AT, § p = 0.009 for BM vs UCT, p = 0.328 for AT vs UCT at Scheffe test for 1:8 ratio in contact cultures; F = 2.86 and p = 0.088 at ANOVA and p = 0.151 for BM vs AT, p = 0.152 for BM vs UCT, p = 0.981 for AT vs UCT at Scheffe test for 1:8 ratio in transwell cultures). AT adipose tissue, BM bone marrow, CTRL control, UCT umbilical cord tissue

References

    1. de Girolamo L, Lucarelli E, Alessandri G, Avanzini MA, Bernardo ME, Biagi E, et al. Mesenchymal stem/stromal cells: a new ''cells as drugs'' paradigm. Efficacy and critical aspects in cell therapy. Curr Pharm Des. 2013;19(13):2459–73. doi: 10.2174/1381612811319130015. - DOI - PMC - PubMed
    1. Nombela-Arrieta C, Ritz J, Silberstein LE. The elusive nature and function of mesenchymal stem cells. Nat Rev Mol Cell Biol. 2011;12(2):126–31. doi: 10.1038/nrm3049. - DOI - PMC - PubMed
    1. Uccelli A, Moretta L, Pistoia V. Mesenchymal stem cells in health and disease. Nat Rev Immunol. 2008;8(9):726–36. doi: 10.1038/nri2395. - DOI - PubMed
    1. Gullo F, De Bari C. Prospective purification of a subpopulation of human synovial mesenchymal stem cells with enhanced chondro-osteogenic potency. Rheumatology (Oxford) 2013;52(10):1758–68. doi: 10.1093/rheumatology/ket205. - DOI - PubMed
    1. Secunda R, Vennila R, Mohanashankar AM, Rajasundari M, Jeswanth S, Surendran R. Isolation, expansion and characterisation of mesenchymal stem cells from human bone marrow, adipose tissue, umbilical cord blood and matrix: a comparative study. Cytotechnology. 2015;67:793–807. doi: 10.1007/s10616-014-9718-z. - DOI - PMC - PubMed