. 2016 Sep;88(3):87-99.
doi: 10.1111/tan.12852. Epub 2016 Aug 24.

HLA class I variation in Iranian Lur and Kurd populations: high haplotype and allotype diversity with an abundance of KIR ligands

Affiliations

HLA class I variation in Iranian Lur and Kurd populations: high haplotype and allotype diversity with an abundance of KIR ligands

E Ashouri et al. HLA. 2016 Sep.

Abstract

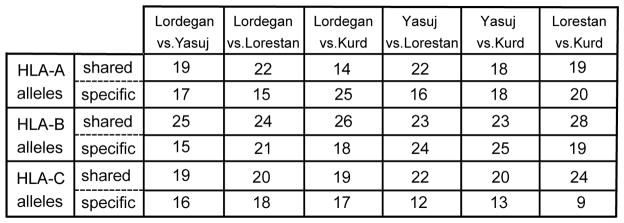
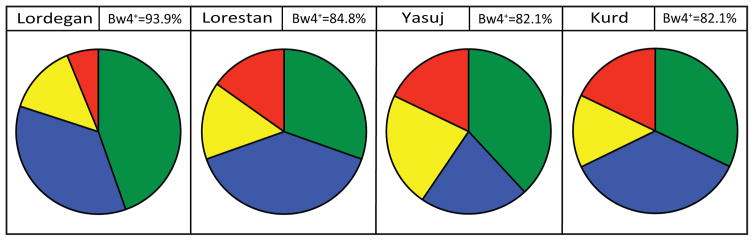
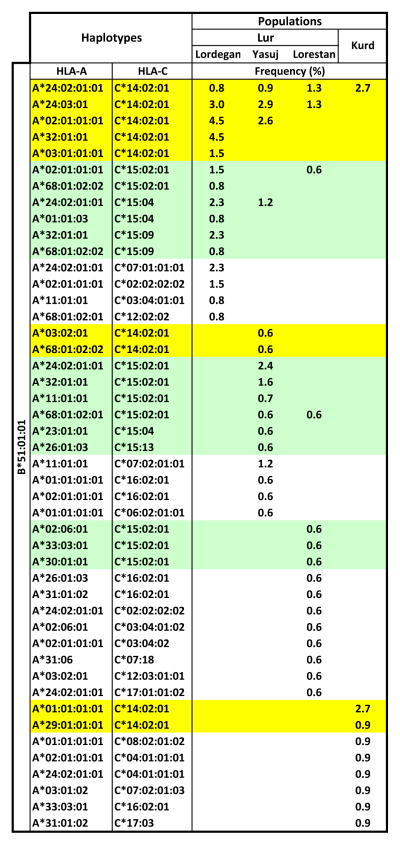
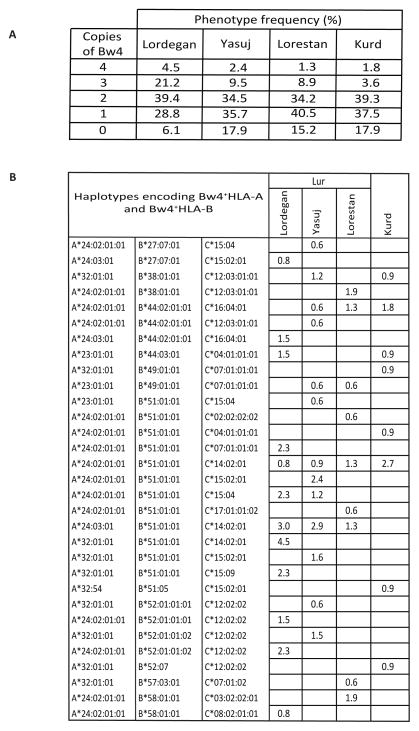
HLA-A, -B and -C alleles of 285 individuals, representing three Iranian Lur populations and one Iranian Kurd population were sequenced completely, yielding human leukocyte antigen (HLA) class I genotypes at high resolution and filling four fields of the official HLA nomenclature. Each population has 87-99 alleles, evenly distributed between the three HLA class I genes, 145 alleles being identified in total. These alleles were already known, named and deposited in the HLA database. The alleles form 316 different HLA A-B-C haplotypes, with each population having between 80 and 112 haplotypes. The four Iranian populations form a related group that is distinguished from other populations, including other Iranians. All four KIR ligands - the A3/11, Bw4, C1 and C2 epitopes - are well represented, particularly Bw4, which is carried by three high-frequency allotypes: HLA-A*24:02, HLA-A*32:01 and HLA-B*51:01. In the Lur and Kurd populations, between 82% and 94% of individuals have the Bw4 epitope, the ligand for KIR3DL1. HLA-B*51:01 is likely of Neandertal origin and associated with Behcet's disease, also known as the Silk Road disease. The Lordegan Lur have the highest frequency of HLA-B*51:01 in the world. This allele is present on 46 Lur and Kurd haplotypes. Present at lower frequency is HLA-B*51:08, which is also associated with Behcet's disease. In the four Iranian populations, 31 haplotypes encode both Bw4(+) HLA-A and Bw4(+) HLA-B, a dual combination of Bw4 epitopes that is relatively rare in other populations, worldwide. This study both demonstrates and emphasizes the value of studying HLA class I polymorphism at highest resolution in anthropologically well-defined populations.

Keywords: Bw4 epitope; HLA class I polymorphism; HLA-B*51:01; Lur and Kurd populations; high-throughput sequencing.


Conflict of interest statement

The authors have declared no conflicting interests.

Figures

Figure 1
Figure 1. Map of Iran showing the regions inhabited by the Kurd, Lorestan, Lordegan and Yasuj populations
The Kurd ethnic group live in Kurdistan province as indicated on the map. Circles show where the four populations reside. The Zagros Mountains extend from the northwest of Iran to the southwest. The thin lines on the map show the boundaries of the Iranian provinces.
Figure 2
Figure 2. Very high HLA-A, -B, -C polymorphism in the Lur and Kurd populations
Shown are the allele frequencies of HLA-A, -B, -C in the four Iranian populations studied here: the Lordegan (2n=132), Yasuj (2n=168) and Lorestan (2n=158) Lur poulations and Kurd (2n=112).
Figure 3
Figure 3. Sharing of HLA-A, -B and -C alleles by Lur and Kurd populations
Shown for each gene, and for each pairwise comparison of two populations, are the number of alleles that are common to the two populations (shared) and the number of alleles that are present in only one of the two populations (specific).
Figure 4
Figure 4. Placing the Lur and Kurd populations in a global context of HLA-A, -B and -C diversity
(A). Shows the results of principal component analysis (PCA) of the Lur, Kurd and 102 other populations using previously described methods (15). Dimension 1 (dim1) accounts for 11.58% of the total variance and dimension 2 (dim2) accounts for an additional 5.87%. The data point for each population is colored according to their geographical region of origin: Amerindian: (AME) pink; Europe (EUR) blue; North Africa (NAF) violet; Northeast Asia (NEA) dark red; Oceania (OCE) green; Southeast Asia (SEA) orange; Sub-Saharan Africa (SSA) yellow; Southwest Asia (SWA) olive. The labels for Individual populations are GK Georgian Kurdish, GK; Georgian, GE; Moroccan-Jews (MJ); Israeli Jews (IJ); North Africans resident in Paris, France (NAP); Arab Druze (AD); Iranian Baloch (BL); Iranian Lordegan Lur (LL); Iranian Lorestan Lur (LR); Iranian Yasuj Lur (LY) and Iranian Kurd (KU). (B). Shows the distribution of variance explained by principal component.
Figure 5
Figure 5. Balancing selection on the TCR binding motif of HLA-C in the Lordegan population
(A). Shown are normalized deviate values of Ewens-Watterson’s F test (Fnd) for polymorphic sequence motifs that influence the binding of HLA-C allotypes to peptide, TCR, KIR and CD8 motifs in the Lur and Kurd populations. The Fnd analysis was performed using the amino acid sequence for each binding motif of HLA class I alleles (15). (p value was calculated using the exact test). (B). Represents the Fnd value of HLA-B motifs in the Lur and Kurd populations with the other major global populations described previously (15). No evidence of balancing selection on these motifs was found in the Lur and Kurd populations. The colors indicate different p values as shown in the color key. ALL: complete polypeptide sequence; A hyphen (−) indicates the motif is monomorphic.
Figure 6
Figure 6. Distribution in the Lur and Kurd populations of the KIR ligands carried by HLA-A, -B and -C allotypes
Shows the allotype frequencies in the four Iranian populations of the six HLA class I epitopes recognized by KIR.
Figure 7
Figure 7. Distribution of the Bw4 epitope in four Iranian populations
The pie charts show the phenotype frequency of Bw4 epitopes in each population. In this analysis both Bw4+ HLA-A and Bw4+ were included and treated equivalently. The colored segments of the pie chart show the phenotype frequencies of Bw4+HLA-A plus Bw4+HLA-B (green); Bw4+HLA-B without Bw4+HLA-A (blue); Bw4+HLA-A without Bw4+HLA-B (yellow) and absence of Bw4 (red). For each population the phenotypic frequency of Bw4 is given in the box next to that containing the name of the population.
Figure 8
Figure 8. Global distribution of HLA-B*51
(A). Gives the phenotype frequencies of HLA-B*51:01 in the four Iranian populations: Lordegan (LL), Yasuj (LY), Lorestan (LR) and Kurd (KU). (*p<0.05,**p<0.01, ***p<0.001). (B). Histogram showing the frequency distribution of the B*51:01 allele in 176 populations (53). Indicated by arrows are the bars containing the four Iranian populations and the Ghanaians (G), British Caucasians (UK) Japanese (J) and Bulgarians (B). The populations were selected for being represented by >40 individuals and for being anthropologically well defined. Populations that lack HLA-B*51:01 were excluded from the analysis. (C). Shows the global distribution of the HLA-B*51 allotype. Each colored circle represents one population studied. The colors give the frequencies, as indicated by the scale at the bottom of the panel. The region where the Lur and Kurd populations reside is indicated by the black arrow, and surrounded by the dark blue ellipse. HLA-B*51 frequencies were obtained from a panel of 208 populations described previously (52).
Figure 9
Figure 9. Diversity of HLA haplotypes containing HLA-B*51:01:01 in the Lur and Kurd populations
Shows the diversity and frequency distributions of B*51-containing HLA haplotyes in the four populations, as estimated using the EM algorithm. Green and yellow shading indicate those haplotypes having HLA-C*15 and HLA-C*14:02:01 alleles, respectively.
Figure 10
Figure 10. Distribution of the Bw4 epitope in Lur and Kurd populations
(A). Shows the phenotype frequencies of individuals having different numbers Bw4 epitopes in the four Iranian populations. (B). Shows the subset of haplotypes that encode both Bw4+HLA-A and Bw4+HLA-B and their frequencies in the four populations.

Similar articles

Cited by

References

    1. Lahr MM, Foley RA. Towards a theory of modern human origins: geography, demography, and diversity in recent human evolution. Am J Phys Anthropol. 1998;(Suppl 27):137–76. - PubMed
    1. Cavalli-Sforza LL. The spread of agriculture and nomadic pastoralism: insights from the genetics, linguistics and archaeology. In: Harris DR, editor. The origins and spread of Agriculture and Pastoralism in Eurasia. London: University College London press; 1996. pp. 51–69.
    1. Hole F. Pastoral nomadism in Western Iran: Explorations in Ethnoarchaeology. University of New Mexico Press; 1978. pp. 127–167.
    1. Zvelebil M. The rise of the nomads in Central Asia. In: Sherratt A, editor. The Cambridge encyclopedia of archaeology. New York: Crown; 1980. pp. 252–256.
    1. Gunter MM. Historical Dictionary of the Kurds. 2. Scarecrow Press; 2011. p. 203.

MeSH terms