. 2016 Aug 24;16(1):311.
doi: 10.1186/s12906-016-1290-y.

Anti-cancer effect of Annona Muricata Linn Leaves Crude Extract (AMCE) on breast cancer cell line

Affiliations

Anti-cancer effect of Annona Muricata Linn Leaves Crude Extract (AMCE) on breast cancer cell line

Syed Umar Faruq Syed Najmuddin et al. BMC Complement Altern Med. .

Abstract

Background: Annona muricata Linn which comes from Annonaceae family possesses many therapeutic benefits as reported in previous studies and to no surprise, it has been used in many cultures to treat various ailments including headaches, insomnia, and rheumatism to even treating cancer. However, Annona muricata Linn obtained from different cultivation area does not necessarily offer the same therapeutic effects towards breast cancer (in regards to its bioactive compound production). In this study, anti-proliferative and anti-cancer effects of Annona muricata crude extract (AMCE) on breast cancer cell lines were evaluated.

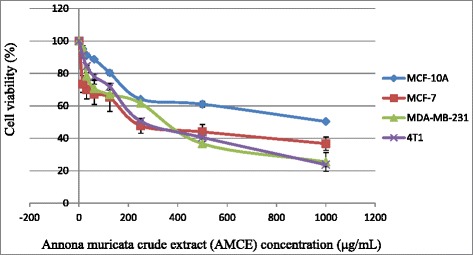
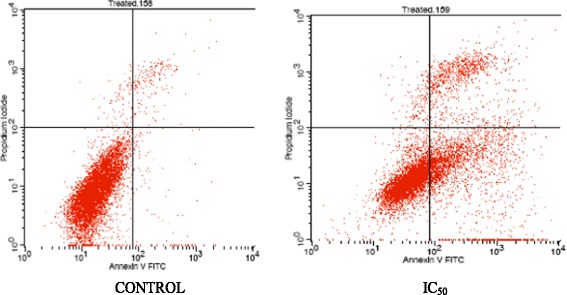
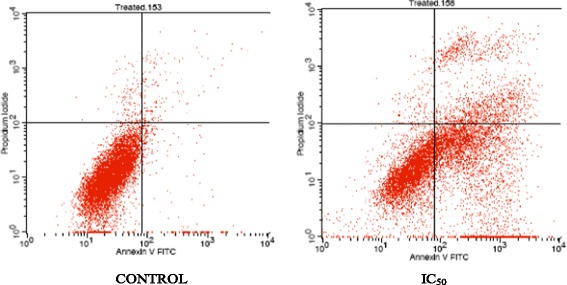
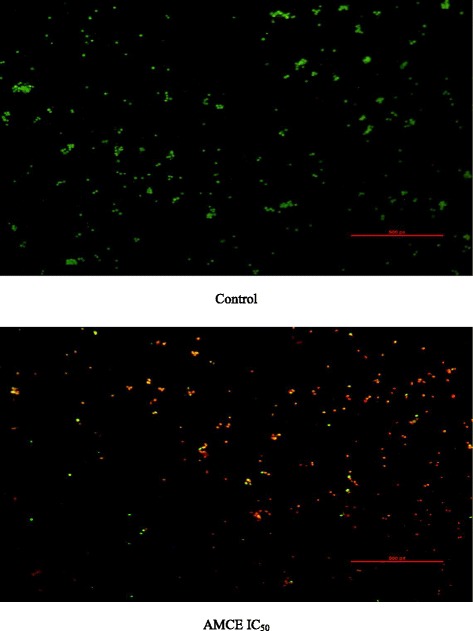
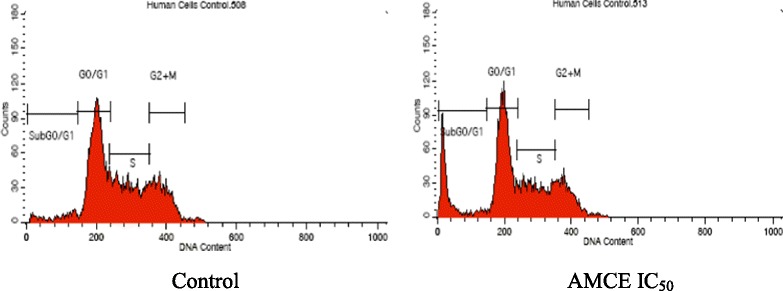
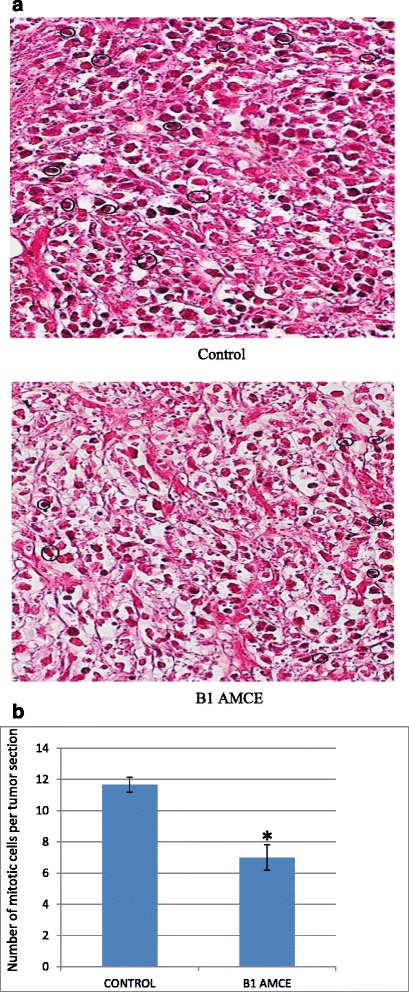
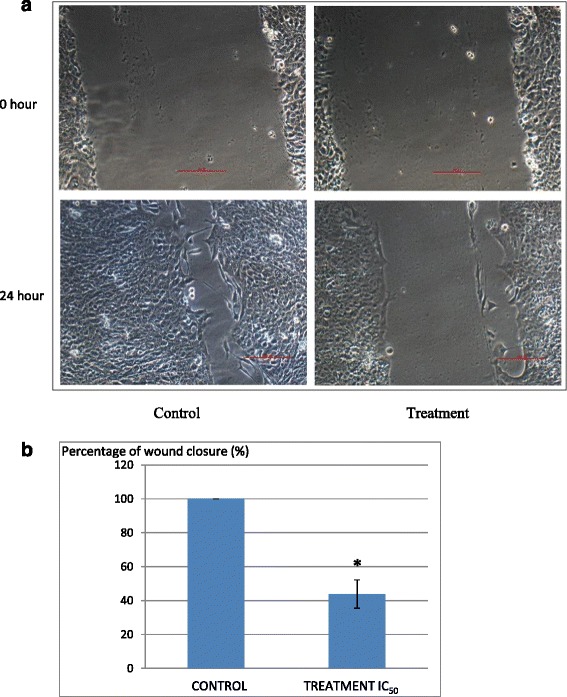
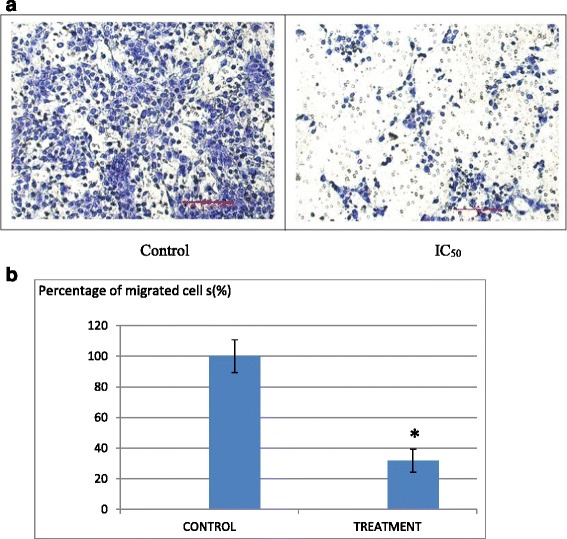
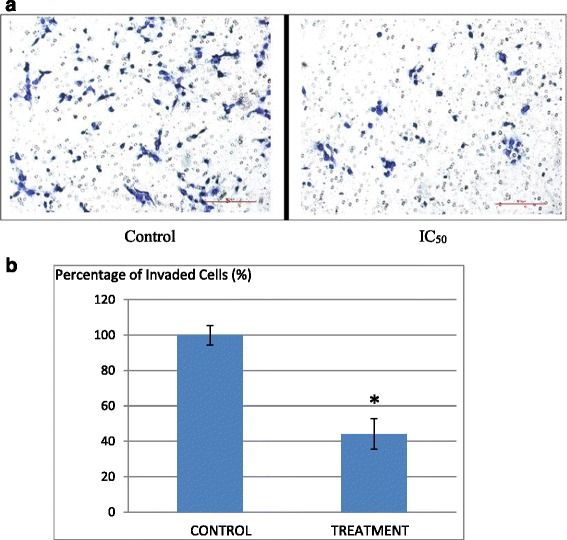
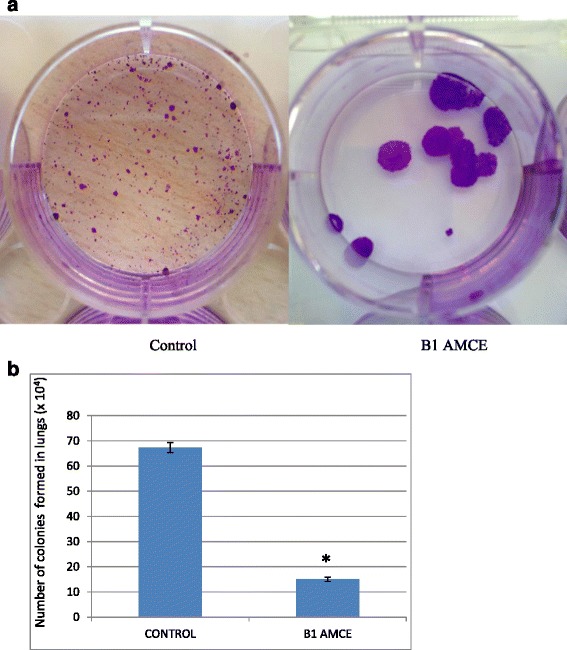
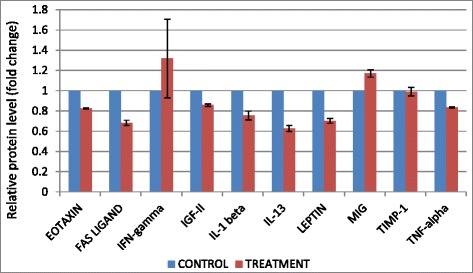
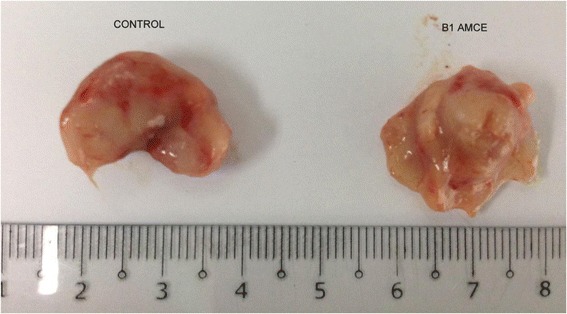
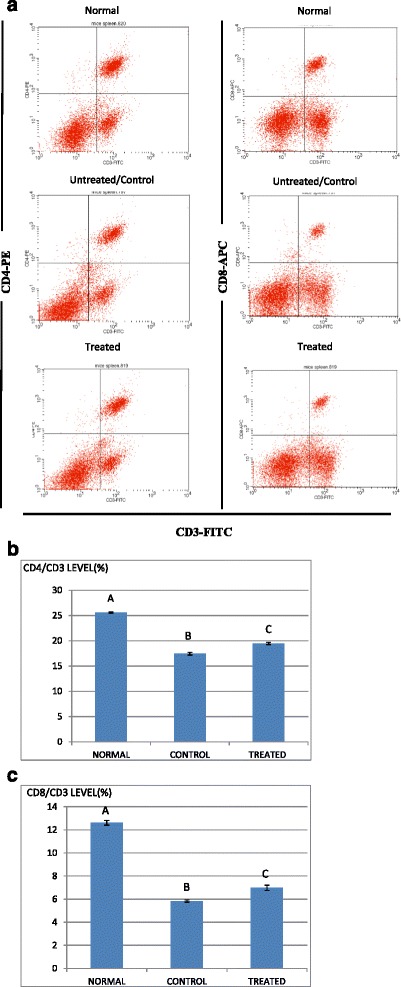
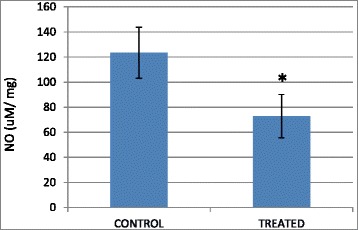
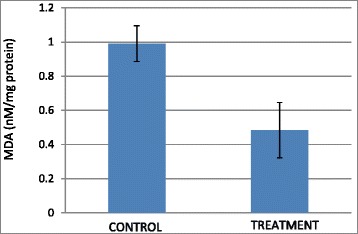
Methods: A screening of nineteen samples of Annona muricata from different location was determined by MTT assay on breast cancer cell lines (MCF-7, MDA-MB-231, and 4 T1) which revealed a varied potency (IC50) amongst them. Then, based on the IC50 profile from the anti-proliferative assay, further downward assays such as cell cycle analysis, Annexin V/FITC, AO/PI, migration, invasion, and wound healing assay were performed only with the most potent leaf aqueous extract (B1 AMCE) on 4 T1 breast cancer cell line to investigate its anti-cancer effect. Then, the in vivo anti-cancer study was conducted where mice were fed with extract after inducing the tumor. At the end of the experiment, histopathology of tumor section, tumor nitric oxide level, tumor malondialdehyde level, clonogenic assay, T cell immunophenotyping, and proteome profiler analysis were performed.

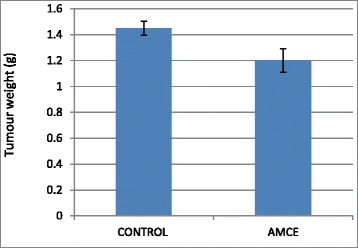
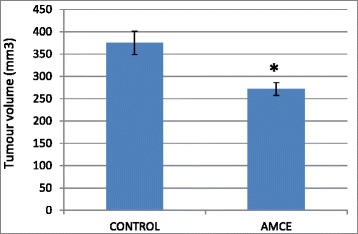
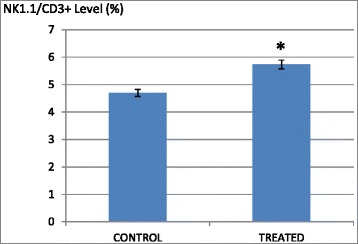
Results: Annona muricata crude extract samples exhibited different level of cytotoxicity toward breast cancer cell lines. The selected B1 AMCE reduced the tumor's size and weight, showed anti-metastatic features, and induced apoptosis in vitro and in vivo of the 4 T1 cells. Furthermore, it decreased the level of nitric oxide and malondialdehyde in tumor while also increased the level of white blood cell, T-cell, and natural killer cell population.

Conclusion: The results suggest that, B1 AMCE is a promising candidate for cancer treatment especially in breast cancer and deserves further research as an alternative to conventional drugs while also stressed out the selection of soursop sample which plays a significant role in determining its potential therapeutic effect on cancer.

Keywords: Annona muricata Linn; Anti-metastatic; Apoptosis; Breast cancer cell line; Immune systems; Inflammation; Leaf aqueous extract; Potency.


Figures

Fig. 1
Fig. 1
Representative MTT assay showing the cytotoxicity activity of B1 AMCE in three different types of cancer cells; MCF 7, MDA-MB-231, and 4 T1 and normal breast cell; MCF-10A after 72 h of incubation in vitro
Fig. 2
Fig. 2
Histogram analysis of Annexin V/FITC in 4 T1 cells after being treated with IC50 concentration of Annona muricata crude extract (AMCE) after 48 h
Fig. 3
Fig. 3
Histogram analysis of Annexin V/FITC in 4 T1 cells after being treated with IC50 concentration of Annona muricata crude extract (AMCE) after 72 h
Fig. 4
Fig. 4
Images represent the control and treated cells which were stained with acridine orange and propidium iodide (AO/PI) after 72 h. 4 T1 cells were treated with IC50 of Annona muricata crude extract from B1 sample. Magnification: 100x
Fig. 5
Fig. 5
Histogram analysis of the cell cycle machinery in 4 T1 cells after being treated with B1 Annona muricata crude extract (AMCE) after 72 h
Fig. 6
Fig. 6
a Histological staining of both the tumors (control and B1 AMCE-treated) with hematoxylin and eosin (H&E). b Quantification of histological staining of the sectioned tumors of control and B1 AMCE-treated group. The dosage used in the treated group was 20 mg/20 g mice B1 Annona muricata crude extract (B1 AMCE). The data are expressed as means ± standard error of the mean for triplicates. Significance is set at *p < 0.05; n = 7 mice per group
Fig. 7
Fig. 7
a Representative images of the wound healing analysis of 4 T1 cell at 0 h and 24 h for control and cells treated with IC50 value of B1 Annona muricata crude extract. Magnification: 100x. b Percentage of wound closure in 4 T1 cells when a wound is introduced. The assay was done in triplicates and the data are expressed as mean ± standard error of mean. Significance is set at *p < 0.05
Fig. 8
Fig. 8
a Images of the in vitro migration analysis of 4 T1 cells; control and cells treated with IC50 value of B1 Annona muricata crude extract. The cells were allowed to migrate through an 8 mm pore membrane for 24 h. b Quantification of migration through 8-mm pore membrane inserts (BD Biosciences) by B1 AMCE-treated 4 T1 cells as a percentage of that achieved by control cells. The assay was done in triplicates and the data are expressed as mean ± standard error of mean. Significance is set at *p < 0.05
Fig. 9
Fig. 9
a Images of the in vitro invasion analysis of 4 T1 cells; control and cells treated with IC50 value of B1 Annona muricata crude extract. The cells were allowed to invade through a layer of Matrigel for 24 h. b Quantification of invasion achieved by the B1 AMCE-treated 4 T1 cells as a percentage of that achieved by control cells. The assay was done in triplicates and the data are expressed as mean ± standard error of mean. Significance is set at *p < 0.05
Fig. 10
Fig. 10
a Representative images of colonies formed in lung from clonogenic assay. Dilution factor: 10-4. b Total 4 T1 colonies formed from meshed lung harvested from the control and B1 AMCE (1 g/kg)-treated mice after 10 days of incubation. The data are expressed as means ± standard error of the mean for triplicates. Significance is set at *p < 0.05; n = 7 mice per group
Fig. 11
Fig. 11
Significant changes of angiogenesis-related proteins level detected by proteome profiler when treated with B1 AMCE (1 g/kg)
Fig. 12
Fig. 12
Images of tumors harvested from control and B1 AMCE (1 g/kg)-treated mice
Fig. 13
Fig. 13
Weight of the tumors was measured after being harvested from the mice after 28 days of treatment. The data are expressed as means ± standard error of the mean for triplicates. n = 7 mice per group
Fig. 14
Fig. 14
Volume of the tumors was measured using a vernier caliper. The data are expressed as means ± standard error of the mean for triplicates. Significance is set at *p < 0.05; n = 7 mice per group
Fig. 15
Fig. 15
a Flow cytometry analysis of immune markers (CD3, CD4, and CD8) on the splenocytes of the normal, control, and B1 AMCE (1 g/kg)-treated mice. b Percentage of CD4/CD3 T cell population from the spleenocytes of the normal, control and B1 AMCE (1 g/ kg)-treated mice as depicted in Fig. 15a. The data are expressed as means ± standard error of the mean for triplicates. Mean values with different superscripts are significantly different p < 0.05; n = 7 mice per group. c Percentage of CD8/CD3 T cell population from the spleenocytes of the normal, control and B1 AMCE (1 g/ kg)-treated mice as depicted in Fig. 15a. The data are expressed as means ± standard error of the mean for triplicates. Mean values with different superscripts are significantly different p < 0.05; n = 7 mice per group
Fig. 16
Fig. 16
Percentage of NK1.1/CD3+ T-cell population from spleenocytes assay of the control and B1 AMCE (1 g/kg)-treated mice. The data are expressed as means ± standard error of the mean for triplicates. Significance is set at *p < 0.05; n = 7 mice per group
Fig. 17
Fig. 17
Level of nitric oxide in the tumors harvested from the control group and B1 AMCE (1 g/kg)-treated group. The data are expressed as means ± standard error of the mean for triplicates. Significance is set at *p < 0.05; n = 7 mice per group
Fig. 18
Fig. 18
Level of malondialdehyde (MDA) in the tumors harvested from the control group and B1 AMCE (1 g/kg)-treated group. The data are expressed as means ± standard error of the mean for triplicates. n = 7 mice per group

Similar articles

Cited by

References

    1. Jemal A, et al. Global cancer statistics. CA Cancer J Clin. 2011;61(2):69–90. doi: 10.3322/caac.20107. - DOI - PubMed
    1. Bermejo A, et al. Acetogenins from Annonaceae: recent progress in isolation, synthesis and mechanisms of action. Nat Prod Rep. 2005;22(2):269–303. doi: 10.1039/B500186M. - DOI - PubMed
    1. Kim GS, et al. Muricoreacin and murihexocin C, mono-tetrahydrofuran acetogenins, from the leaves of Annona muricata. Phytochemistry. 1998;49(2):565–71. doi: 10.1016/S0031-9422(98)00172-1. - DOI - PubMed
    1. Rieser MJ, et al. Five novel mono-tetrahydrofuran ring acetogenins from the seeds of Annona muricata. J Nat Prod. 1996;59(2):100–8. doi: 10.1021/np960037q. - DOI - PubMed
    1. Alali FQ, Liu XX, McLaughlin JL. Annonaceous acetogenins: recent progress. J Nat Prod. 1999;62(3):504–40. doi: 10.1021/np980406d. - DOI - PubMed