. 2016 Nov;26(11):1588-1599.
doi: 10.1101/gr.202903.115. Epub 2016 Aug 24.

A generic, cost-effective, and scalable cell lineage analysis platform

Affiliations

A generic, cost-effective, and scalable cell lineage analysis platform

Tamir Biezuner et al. Genome Res. 2016 Nov.

Abstract

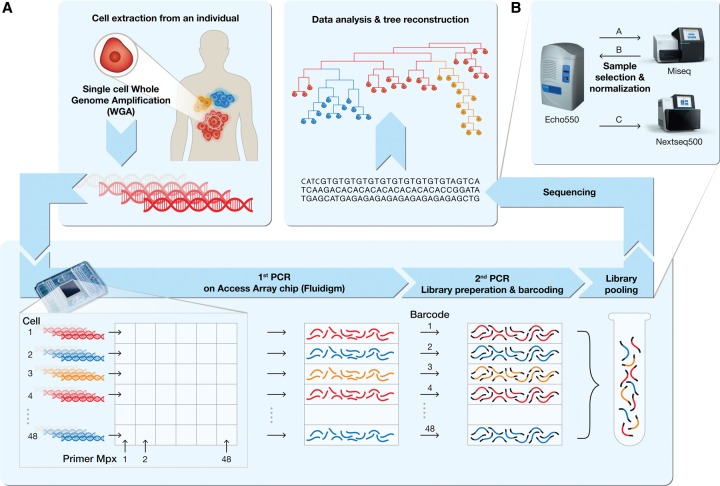
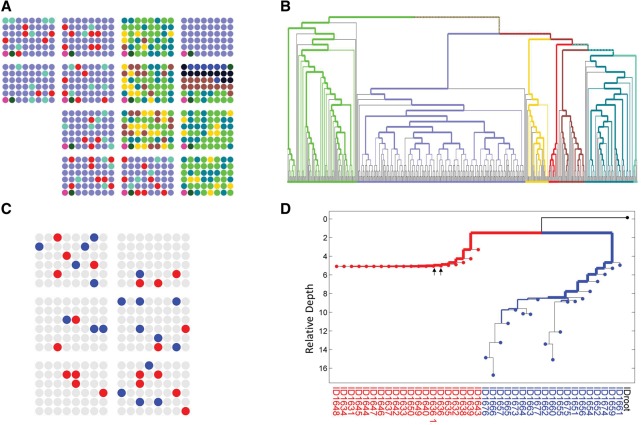
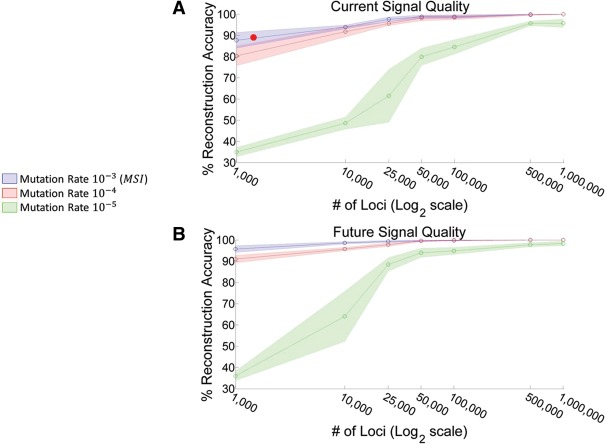
Advances in single-cell genomics enable commensurate improvements in methods for uncovering lineage relations among individual cells. Current sequencing-based methods for cell lineage analysis depend on low-resolution bulk analysis or rely on extensive single-cell sequencing, which is not scalable and could be biased by functional dependencies. Here we show an integrated biochemical-computational platform for generic single-cell lineage analysis that is retrospective, cost-effective, and scalable. It consists of a biochemical-computational pipeline that inputs individual cells, produces targeted single-cell sequencing data, and uses it to generate a lineage tree of the input cells. We validated the platform by applying it to cells sampled from an ex vivo grown tree and analyzed its feasibility landscape by computer simulations. We conclude that the platform may serve as a generic tool for lineage analysis and thus pave the way toward large-scale human cell lineage discovery.


Figures

Figure 1.
Figure 1.
A schematic pipeline of the single-cell lineage analysis platform. (A) Tumor and metastases are given as an example for the utilization of the platform to study cancer dynamics (red, yellow, and blue cell populations). (Top left box) Single cells are extracted from an individual, and DNA is extracted and amplified using whole-genome amplification (WGA). (Bottom box) The amplified DNA from the cells to be analyzed as well as PCR primer pairs in multiplex groups are fed to an Access Array microfluidic chip (Fluidigm). The first PCR targets thousands of specific loci (mainly MSs) from each single-cell DNA. All PCR products of the same cell are harvested into a single well. The second PCR adds a universal sequence at both sides of the first PCR products, where each sample is barcoded with a unique set of primer pairs, resulting in a sequencing-ready library. Pooling the libraries and sequencing them (top right box) enables the analysis and reconstruction of the cell lineage tree. An elaboration of the process is described in the Methods section and Supplemental Figures S1 and S2. (B) Schematic representation of the normalization intended for equalization of reads distribution between samples in a multiplexed NGS run. (A) An equal volume of samples at equal concentrations is pooled and sequenced in a low-coverage sequencing run (Miseq, Illumina). (B) Volume normalization according to user-defined parameters is performed, and (C) another cherry picking is carried out according to normalized volumes (see Supplemental Fig. S6).
Figure 2.
Figure 2.
Cell lineage analysis of a controlled ex vivo tree. Schematic representation of the ex vivo SC clone tree experiment. (A) Single cells are picked from a plate to form colonies. After a limited number of cell divisions, cells are picked from each clone to form SC subclones. Repeating this step generates a SC clone tree with a known structure. (B) Collaterally, in each passage in which single cells are selected for SC subcloning, single cells are picked to a PCR plate for WGA and subsequent cell lineage analysis.
Figure 3.
Figure 3.
Reconstruction of the cancer ex vivo SC clone tree using the parameters that were calibrated using the simulations. (A) A schematic representation of the known cancer ex vivo SC clone tree. The numbers within the boxes indicate the number of single cells sampled from the specific subclone (total of 167 samples). (B,C) Close-up view of the indicated reconstructed subtrees. Edge colors in the reconstructed tree indicate statistically significant clustering as described in Shlush et al. (2012) and match the box colors of the subclones in A. Trees are drawn as ultrametric (all leaves are equidistant from the root) for clarity. The full, reconstructed tree can be found in Supplemental Figure S14. (D) Percentage of correct triples as a function of the length between the two MRCAs of the triple (see Supplemental Figs. S18, S19). The overall average score is 89%. (E) Correlation between the reconstructed cell depth, corresponding to the number of cell divisions from the root, and the subclone level.
Figure 4.
Figure 4.
In vivo cell lineage tree reconstruction of human cells. To validate the reconstruction of human in vivo samples, we first selected single-cell samples from seven human individuals and distributed them among different AA chips. (A) Representation of different cell samples in 48-well batches (circles) in 14 AA chips, with colors indicating different source individuals. (B) As expected, cell lineage reconstruction of samples from A demonstrates accurate reconstruction of human samples in accordance with individual donors. The width of the colored branches represents the significance of the clustering, which was calculated using a hypergeometric test (wider = lower P-value) (see Supplemental Note S3). Branches are colored in accordance with the colors in A. The two bottom left samples of each AA chip correspond to a positive control (dark green) and negative control (pink). (C,D) Cell lineage reconstruction of melanoma and normal lymphocytes from the same patient (YUCLAT) (Krauthammer et al. 2015). (C) Same representation as in A: Metastatic melanoma (red) and normal PBL (blue) were randomly distributed over six AA chips. (D) Cell lineage reconstruction of samples from C demonstrates a perfect separation between the two cell populations. Arrows indicate a SC sample duplicate.
Figure 5.
Figure 5.
Reconstruction accuracy as a function of the number of MS loci of the simulated ex vivo tree (a random reconstructed tree achieves an accuracy of 33%). (A) Reconstruction accuracy as a function of the number of MS loci using current signal quality as calibrated from the ex vivo experiments. Green and red areas represent performance accuracy of normal cells (medium and lower mutation rates), whereas the blue area represents accuracy of MSI cells (higher mutation rate). Note that the signal quality of MSI cells is lower than that of the normal cells due to chromosomal aberrations. The red circle indicates performance of the current ∼2000 loci panel as applied to the cancer ex vivo experiment. (B) Same as A but using improved signal parameters (less noise and less dropout) expected in the future. Inner lines represent average results over 10 simulations and shaded areas represent the standard deviation.

References

    1. Boyer JC, Umar A, Risinger JI, Lipford JR, Kane M, Yin S, Barrett JC, Kolodner RD, Kunkel TA. 1995. Microsatellite instability, mismatch repair deficiency, and genetic defects in human cancer cell lines. Cancer Res 55: 6063–6070. - PubMed
    1. Buenrostro JD, Wu B, Litzenburger UM, Ruff D, Gonzales ML, Snyder MP, Chang HY, Greenleaf WJ. 2015. Single-cell chromatin accessibility reveals principles of regulatory variation. Nature 523: 486–490. - PMC - PubMed
    1. Cai X, Evrony GD, Lehmann HS, Elhosary PC, Mehta BK, Poduri A, Walsh CA. 2014. Single-cell, genome-wide sequencing identifies clonal somatic copy-number variation in the human brain. Cell Rep 8: 1280–1289. - PMC - PubMed
    1. Carlson C, Kas A, Kirkwood R, Hays L, Preston B, Salipante S, Horwitz M. 2012. Decoding cell lineage from acquired mutations using arbitrary deep sequencing. Nat Methods 9: 78–80. - PMC - PubMed
    1. Carlson KD, Sudmant PH, Press MO, Eichler EE, Shendure J, Queitsch C. 2015. MIPSTR: a method for multiplex genotyping of germline and somatic STR variation across many individuals. Genome Res 25: 750–761. - PMC - PubMed

Publication types