

Systems-level effects of ectopic galectin-7 reconstitution in cervical cancer and its microenvironment
- PMID: 27558259
- PMCID: PMC4997669
- DOI: 10.1186/s12885-016-2700-8
Systems-level effects of ectopic galectin-7 reconstitution in cervical cancer and its microenvironment
Abstract
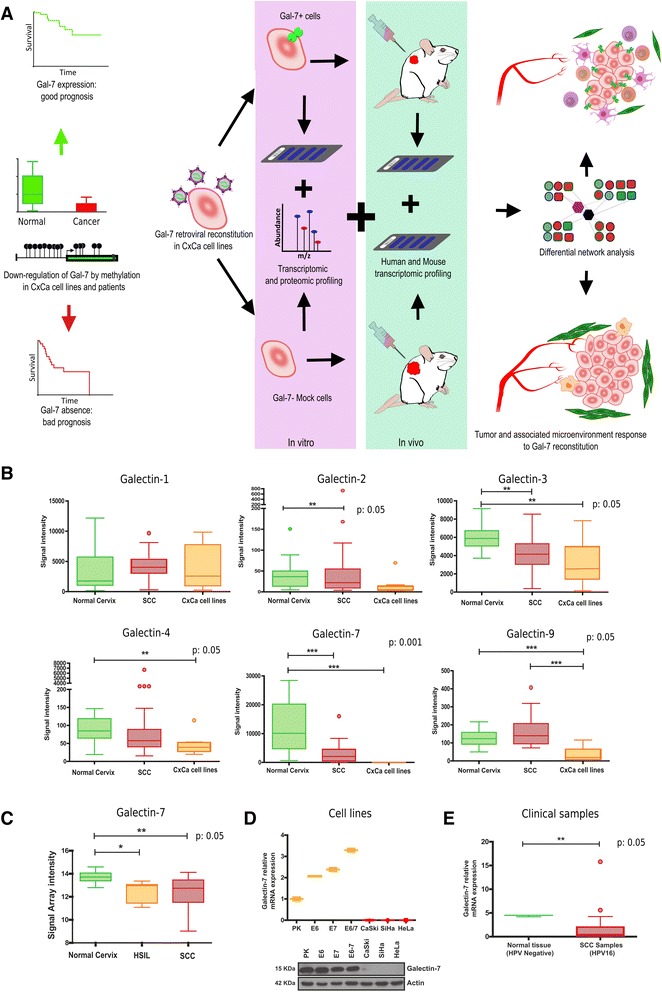
Background: Galectin-7 (Gal-7) is negatively regulated in cervical cancer, and appears to be a link between the apoptotic response triggered by cancer and the anti-tumoral activity of the immune system. Our understanding of how cervical cancer cells and their molecular networks adapt in response to the expression of Gal-7 remains limited.
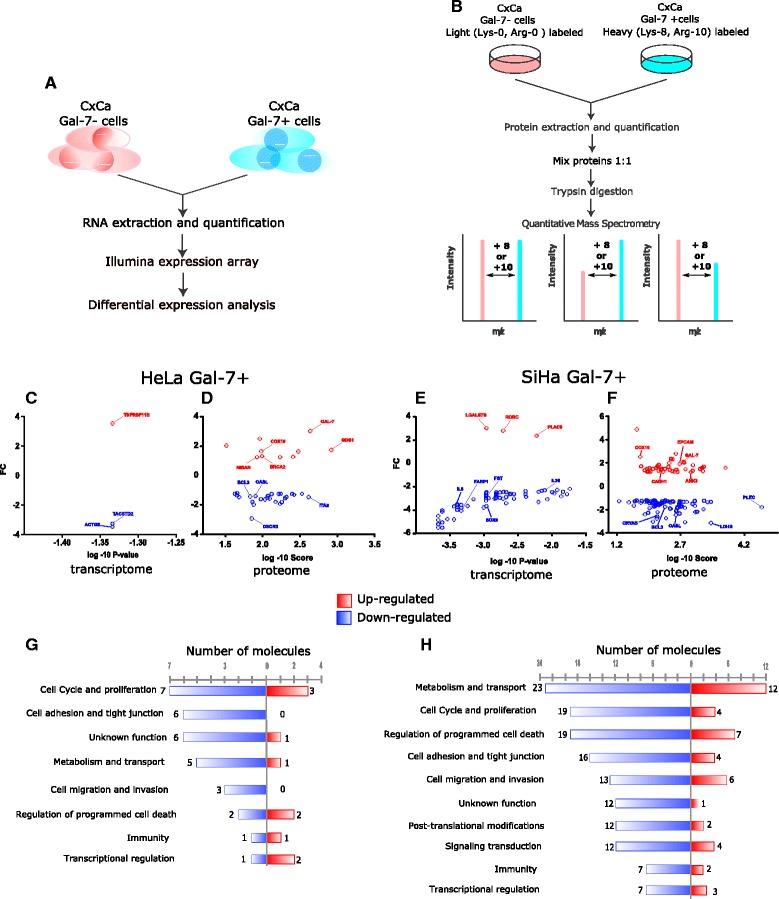
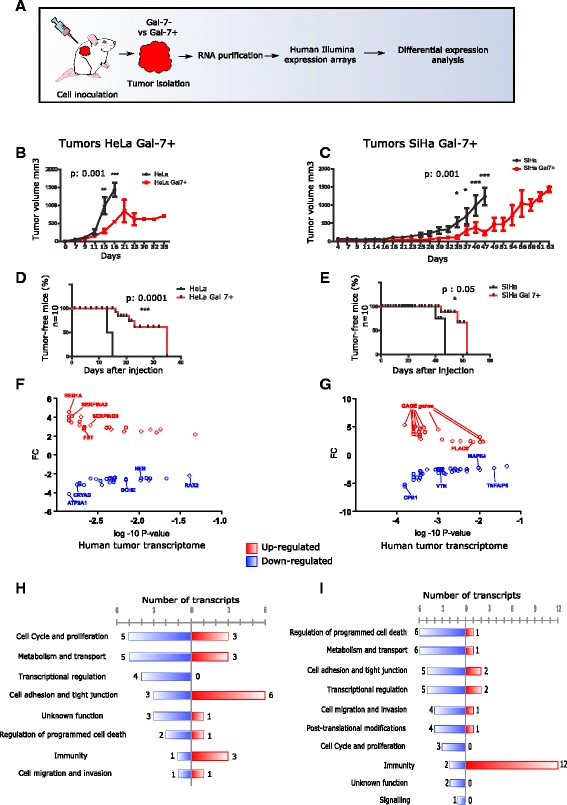
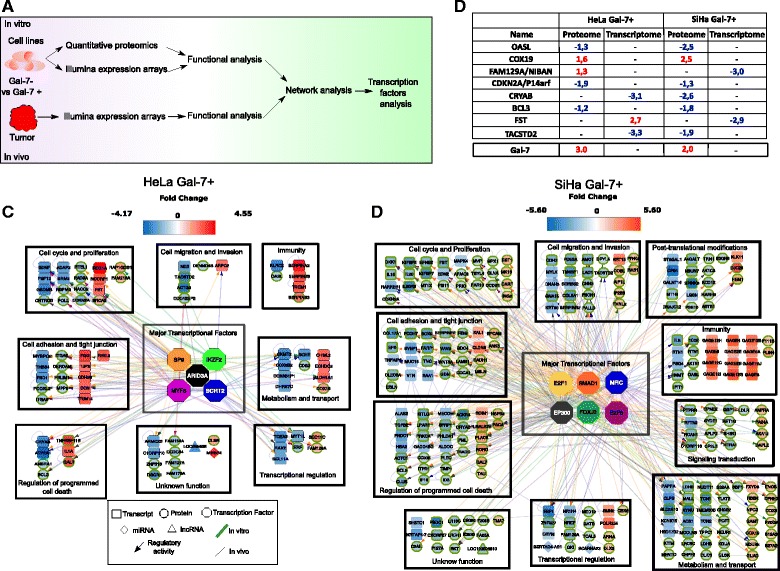
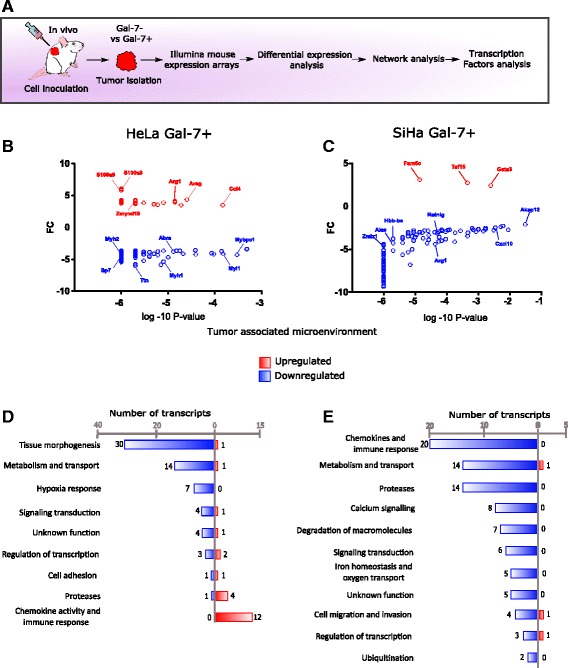
Methods: Meta-analysis of Gal-7 expression was conducted in three cervical cancer cohort studies and TCGA. In silico prediction and bisulfite sequencing were performed to inquire epigenetic alterations. To study the effect of Gal-7 on cervical cancer, we ectopically re-expressed it in the HeLa and SiHa cervical cancer cell lines, and analyzed their transcriptome and SILAC-based proteome. We also examined the tumor and microenvironment host cell transcriptomes after xenotransplantation into immunocompromised mice. Differences between samples were assessed with the Kruskall-Wallis, Dunn's Multiple Comparison and T tests. Kaplan-Meier and log-rank tests were used to determine overall survival.
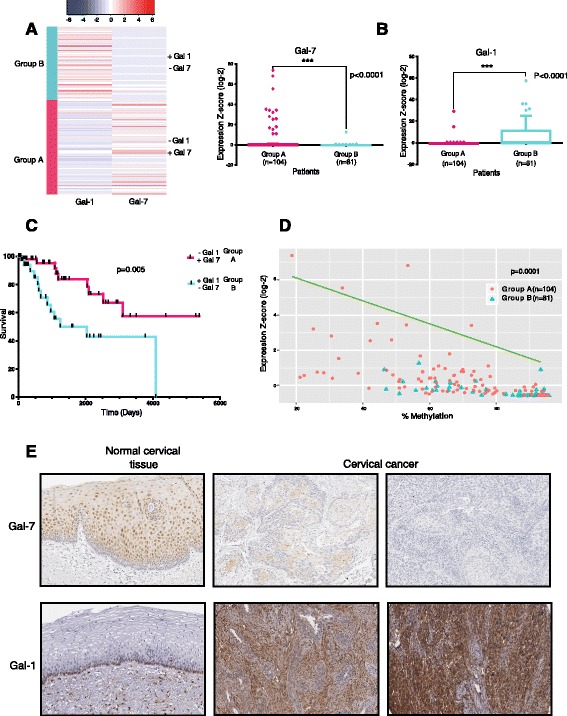
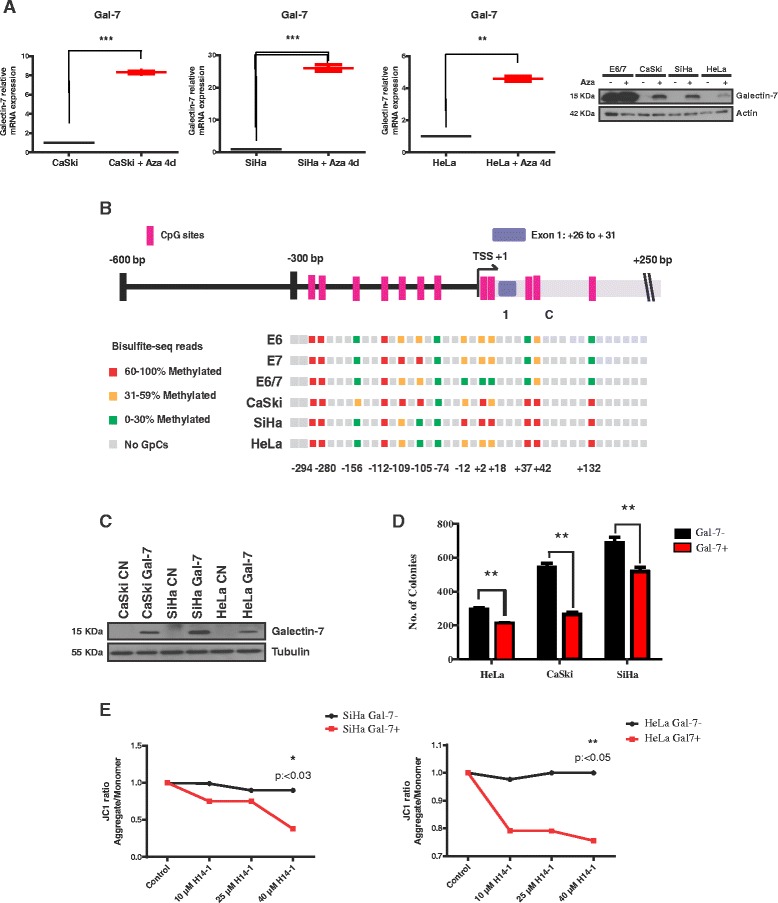
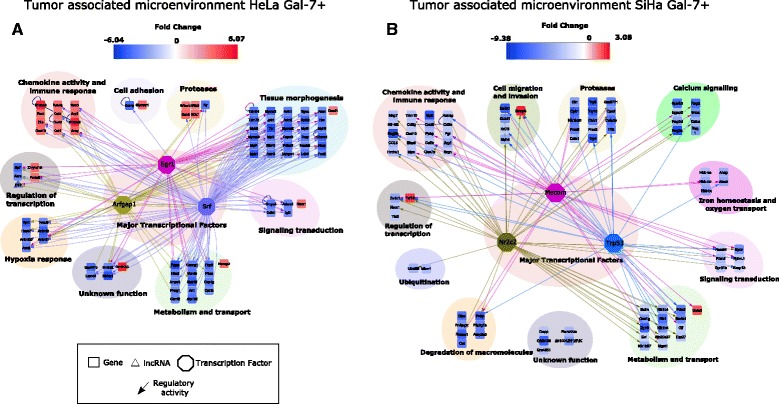
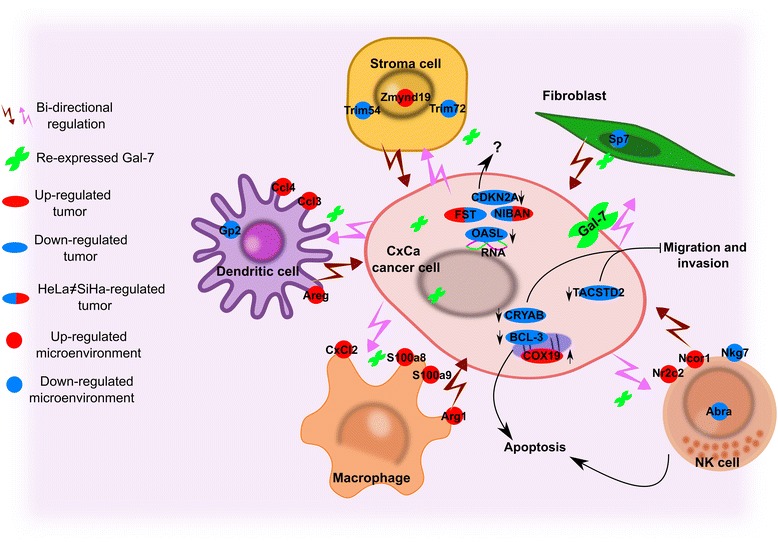
Results: Gal-7 was constantly downregulated in our meta-analysis (p < 0.0001). Tumors with combined high Gal-7 and low galectin-1 expression (p = 0.0001) presented significantly better prognoses (p = 0.005). In silico and bisulfite sequencing assays showed de novo methylation in the Gal-7 promoter and first intron. Cells re-expressing Gal-7 showed a high apoptosis ratio (p < 0.05) and their xenografts displayed strong growth retardation (p < 0.001). Multiple gene modules and transcriptional regulators were modulated in response to Gal-7 reconstitution, both in cervical cancer cells and their microenvironments (FDR < 0.05 %). Most of these genes and modules were associated with tissue morphogenesis, metabolism, transport, chemokine activity, and immune response. These functional modules could exert the same effects in vitro and in vivo, even despite different compositions between HeLa and SiHa samples.
Conclusions: Gal-7 re-expression affects the regulation of molecular networks in cervical cancer that are involved in diverse cancer hallmarks, such as metabolism, growth control, invasion and evasion of apoptosis. The effect of Gal-7 extends to the microenvironment, where networks involved in its configuration and in immune surveillance are particularly affected.
Keywords: Cervical cancer; Differential network analysis; Galectin-7; Microenvironment crosstalk.
Figures
Similar articles
-
A unique galectin signature in human prostate cancer progression suggests galectin-1 as a key target for treatment of advanced disease.Cancer Res. 2013 Jan 1;73(1):86-96. doi: 10.1158/0008-5472.CAN-12-1260. Epub 2012 Oct 29. Cancer Res. 2013. PMID: 23108139
-
Galectin-1, -3 and -9 Expression and Clinical Significance in Squamous Cervical Cancer.PLoS One. 2015 Jun 12;10(6):e0129119. doi: 10.1371/journal.pone.0129119. eCollection 2015. PLoS One. 2015. PMID: 26066796 Free PMC article.
-
Galectin 1 expression is associated with tumor invasion and metastasis in stage IB to IIA cervical cancer.Hum Pathol. 2013 Jan;44(1):62-8. doi: 10.1016/j.humpath.2012.04.010. Epub 2012 Aug 30. Hum Pathol. 2013. PMID: 22939954
-
Galectins as pivotal components in oncogenesis and immune exclusion in human malignancies.Front Immunol. 2023 Feb 3;14:1145268. doi: 10.3389/fimmu.2023.1145268. eCollection 2023. Front Immunol. 2023. PMID: 36817445 Free PMC article. Review.
-
The Role of Galectins in Cervical Cancer Biology and Progression.Biomed Res Int. 2018 May 8;2018:2175927. doi: 10.1155/2018/2175927. eCollection 2018. Biomed Res Int. 2018. PMID: 29854732 Free PMC article. Review.
Cited by
-
Galectin-7 reprograms skin carcinogenesis by fostering innate immune evasive programs.Cell Death Differ. 2023 Apr;30(4):906-921. doi: 10.1038/s41418-022-01108-7. Epub 2023 Jan 24. Cell Death Differ. 2023. PMID: 36693903 Free PMC article.
-
Galectin Family Members: Emerging Novel Targets for Lymphoma Therapy?Front Oncol. 2022 May 23;12:889034. doi: 10.3389/fonc.2022.889034. eCollection 2022. Front Oncol. 2022. PMID: 35677161 Free PMC article. Review.
-
Bulk and single-cell transcriptome profiling reveal the metabolic heterogeneity in gastric cancer.Sci Rep. 2023 May 31;13(1):8787. doi: 10.1038/s41598-023-35395-y. Sci Rep. 2023. PMID: 37258571 Free PMC article.
-
Identification of a gene signature for discriminating metastatic from primary melanoma using a molecular interaction network approach.Sci Rep. 2017 Dec 11;7(1):17314. doi: 10.1038/s41598-017-17330-0. Sci Rep. 2017. PMID: 29229936 Free PMC article.
-
Multi-omics Data Analyses Construct TME and Identify the Immune-Related Prognosis Signatures in Human LUAD.Mol Ther Nucleic Acids. 2020 Sep 4;21:860-873. doi: 10.1016/j.omtn.2020.07.024. Epub 2020 Jul 23. Mol Ther Nucleic Acids. 2020. PMID: 32805489 Free PMC article.
References
Publication types
MeSH terms
Substances
LinkOut - more resources
Full Text Sources
Other Literature Sources
Medical
Molecular Biology Databases
Research Materials
