. 2016 Aug 24;17(1):676.
doi: 10.1186/s12864-016-2966-x.

Whole-genome characterization in pedigreed non-human primates using genotyping-by-sequencing (GBS) and imputation

Affiliations

Whole-genome characterization in pedigreed non-human primates using genotyping-by-sequencing (GBS) and imputation

Benjamin N Bimber et al. BMC Genomics. .

Abstract

Background: Rhesus macaques are widely used in biomedical research, but the application of genomic information in this species to better understand human disease is still in its infancy. Whole-genome sequence (WGS) data in large pedigreed macaque colonies could provide substantial experimental power for genetic discovery, but the collection of WGS data in large cohorts remains a formidable expense. Here, we describe a cost-effective approach that selects the most informative macaques in a pedigree for 30X WGS, followed by low-cost genotyping-by-sequencing (GBS) at 30X on the remaining macaques in order to generate sparse genotype data at high accuracy. Dense variants from the selected macaques with WGS data are then imputed into macaques having only sparse GBS data, resulting in dense genome-wide genotypes throughout the pedigree.

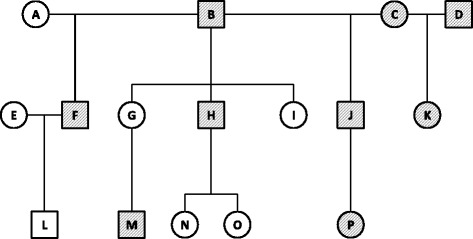
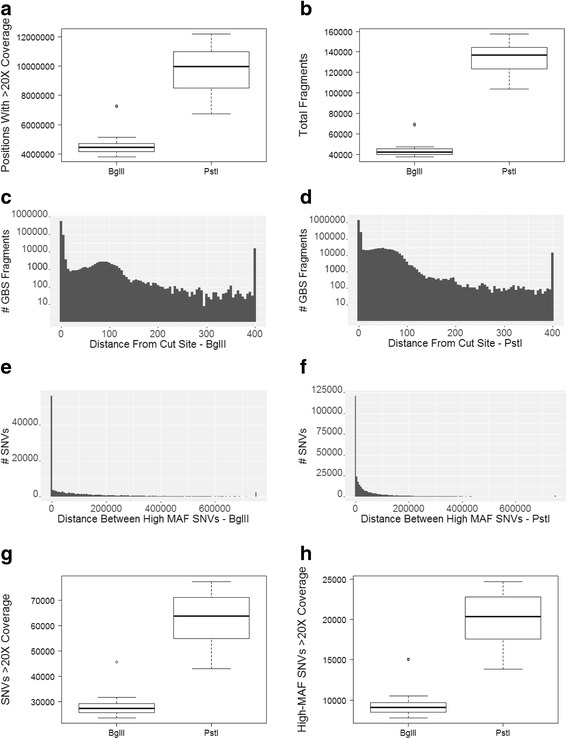
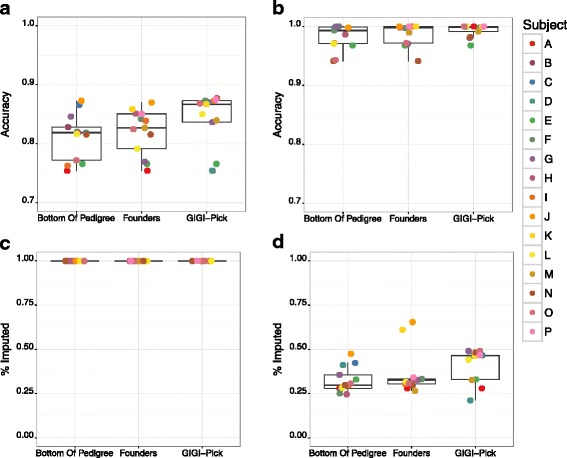
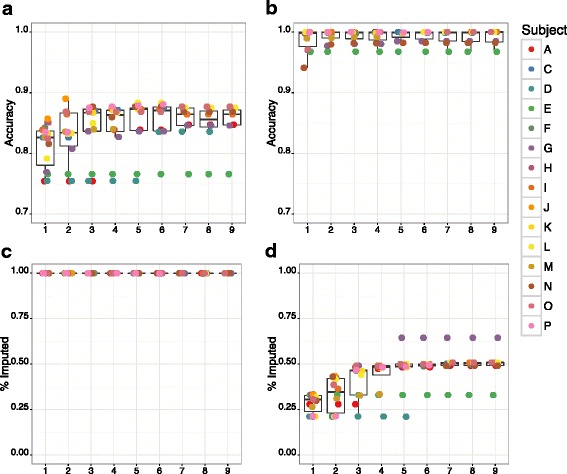
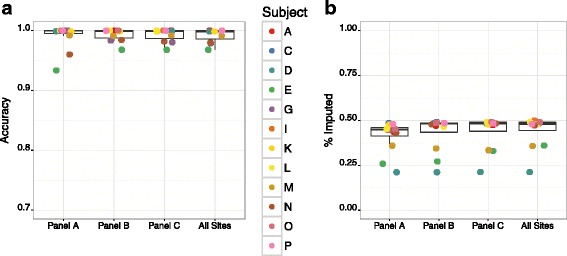
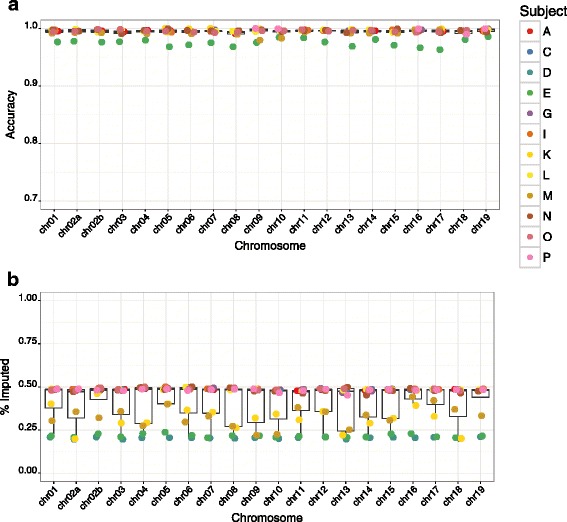
Results: We developed GBS for the macaque genome using a digestion with PstI, followed by sequencing of size-selected fragments at 30X coverage. From GBS sequence data collected on all individuals in a 16-member pedigree, we characterized high-confidence genotypes at 22,455 single nucleotide variant (SNV) sites that were suitable for guiding imputation of dense sequence data from WGS. To characterize dense markers for imputation, we performed WGS at 30X coverage on nine of the 16 individuals, yielding 10,193,425 high-confidence SNVs. To validate the use of GBS data for facilitating imputation, we initially focused on chromosome 19 as a test case, using an optimized panel of 833 sparse, evenly-spaced markers from GBS and 5,010 dense markers from WGS. Using the method of "Genotype Imputation Given Inheritance" (GIGI), we evaluated the effects on imputation accuracy of 3 different strategies for selecting individuals for WGS, including 1) using "GIGI-Pick" to select the most informative individuals, 2) using the most recent generation, or 3) using founders only. We also evaluated the effects on imputation accuracy of using a range of from 1 to 9 WGS individuals for imputation. We found that the GIGI-Pick algorithm for selection of WGS individuals outperformed common heuristic approaches, and that genotype numbers and accuracy improved very little when using >5 WGS individuals for imputation. Informed by our findings, we used 4 macaques with WGS data to impute variants at up to 7,655,491 sites spanning all 20 autosomes in the 12 remaining macaques, based on their GBS genotypes at only 17,158 loci. Using a strict confidence threshold, we imputed an average of 3,680,238 variants per individual at >99 % accuracy, or an average 4,458,883 variants per individual at a more relaxed threshold, yielding >97 % accuracy.

Conclusions: We conclude that an optimal tradeoff between genotype accuracy, number of imputed genotypes, and overall cost exists at the ratio of one individual selected for WGS using the GIGI-Pick algorithm, per 3-5 relatives selected for GBS. This approach makes feasible the collection of accurate, dense genome-wide sequence data in large pedigreed macaque cohorts without the need for more expensive WGS data on all individuals.

Keywords: Whole-genome sequencing; genotyping-by-sequencing; imputation; macaque; pedigree.


Figures

Fig. 1
Fig. 1
Pedigree diagram of the 16 macaques included in this study. Macaques with whole genome sequence data are shaded; all subjects have GBS data
Fig. 2
Fig. 2
Evaluation of GBS library coverage and SNVs. a The number of positions with ≥20X coverage; b Total contiguous fragments with >20X coverage; c Distance between each GBS fragment and nearest predicted cut site for the BglII libraries (all fragments > 400 bp are grouped into a single bin); d Distance between each GBS fragment and the nearest predicted cut site for PstI libraries; e Distance between high MAF (> 0.25) SNVs in BglII; f Distance between high MAF SNVs in PstI; g Total SNVs detected per enzyme, and h total SNVs with MAF > 0.25
Fig. 3
Fig. 3
Imputation accuracy on chromosome 19, among different strategies for selecting 3 individuals for WGS. Comparison of imputation accuracy among 3 different strategies for selecting 3 individuals for WGS within the 16-member pedigree: “Bottom of Pedigree” (subjects M, P, K), “Founders” (subjects B, C, D), and “GIGI-Pick” (B, H, J). Imputation of an optimal set of dense markers was conducted for chromosome 19 from the 3 individuals with WGS, into the 13 recipient individuals with GBS data, using the GIGI imputation algorithm with the “Most-Likely” (A) and “Threshold” (B) genotype calling methods. The corresponding fraction of markers imputed are shown for “Most-Likely” (C) and “Threshold” (D) methods. Circles denote individual animals as indicated in the legend; we note that not every individual may be distinguished in these graphs due to overlapping values
Fig. 4
Fig. 4
Imputation accuracy on chromosome 19 by total number of individuals selected for WGS. Accuracy for an optimal set of dense markers on chromosome 19, using 1–9 individuals with WGS data, imputed into all remaining pedigree members with GBS data, using the “Most Likely” genotype calling method (A, C) or by assigning genotypes based on hard probability thresholds (“Threshold”) (B, D). Circles denote individual animals as indicated in the legend; we note that not every individual may be distinguished in these graphs due to overlapping values. Individuals with WGS data were ranked by the GIGI-Pick algorithm [14] and used for imputation in the following order: B, H, J, F, M, K, P, C, D (see Fig. 1)
Fig. 5
Fig. 5
Imputation accuracy on chromosome 19 by density of framework marker panel. A) Accuracy for an optimal set of dense markers on chromosome 19, using 4 individuals with WGS data, imputed into all remaining pedigree members with GBS data. Circles denote individual animals as indicated in the legend; we note that not every individual may be distinguished in these graphs due to overlapping values. Framework marker panels were designed by selecting positions with GBS data that intersect with SNVs of MAF >0.25. Three framework panels were tested: 325 SNVs present in all 16 individuals (Panel A); 811 SNVs present in 8/16 individuals (Panel B); 1,027 SNVs present in 4/16 individuals (Panel C), and 2,737 SNVs that include all sites with high-confidence genotypes in the GBS data (All sites). B) The fraction of dense markers imputed using hard probability thresholds for calling genotypes, as described in Results
Fig. 6
Fig. 6
Imputation accuracy across the genome at a comprehensive set of dense markers. A) Accuracy of alleles imputed across all autosomes at 7,655,491 possible sites, and B) fraction of markers which were imputed using hard probability thresholds for calling genotypes, as described in Results. Data represent accuracy of alleles at dense markers for 12 pedigree members with GBS data, imputed from individuals B, H, J, and F, called using the “Threshold” method for calling genotypes. Circles denote individual animals as indicated in the legend; we note that not every individual may be distinguished in these graphs due to overlapping values

References

    1. Meynert AM, Ansari M, FitzPatrick DR, Taylor MS. Variant detection sensitivity and biases in whole genome and exome sequencing. BMC Bioinformatics. 2014;15:247. doi: 10.1186/1471-2105-15-247. - DOI - PMC - PubMed
    1. Li Y, Sidore C, Kang HM, Boehnke M, Abecasis GR. Low-coverage sequencing: implications for design of complex trait association studies. Genome Res. 2011;21(6):940–51. doi: 10.1101/gr.117259.110. - DOI - PMC - PubMed
    1. Bielenberg DG, Rauh B, Fan S, Gasic K, Abbott AG, Reighard GL, Okie WR, Wells CE. Genotyping by Sequencing for SNP-Based Linkage Map Construction and QTL Analysis of Chilling Requirement and Bloom Date in Peach [Prunus persica (L.) Batsch] PLoS One. 2015;10(10):e0139406. doi: 10.1371/journal.pone.0139406. - DOI - PMC - PubMed
    1. De Donato M, Peters SO, Mitchell SE, Hussain T, Imumorin IG. Genotyping-by-sequencing (GBS): a novel, efficient and cost-effective genotyping method for cattle using next-generation sequencing. PLoS One. 2013;8(5):e62137. doi: 10.1371/journal.pone.0062137. - DOI - PMC - PubMed
    1. Palti Y, Vallejo RL, Gao G, Liu S, Hernandez AG, Rexroad CE, 3rd, Wiens GD. Detection and Validation of QTL Affecting Bacterial Cold Water Disease Resistance in Rainbow Trout Using Restriction-Site Associated DNA Sequencing. PLoS One. 2015;10(9):e0138435. doi: 10.1371/journal.pone.0138435. - DOI - PMC - PubMed

Publication types

MeSH terms

LinkOut - more resources