. 2016 Aug 24;10(1):82.
doi: 10.1186/s12918-016-0325-9.

How time delay and network design shape response patterns in biochemical negative feedback systems

Affiliations

How time delay and network design shape response patterns in biochemical negative feedback systems

Anastasiya Börsch et al. BMC Syst Biol. .

Abstract

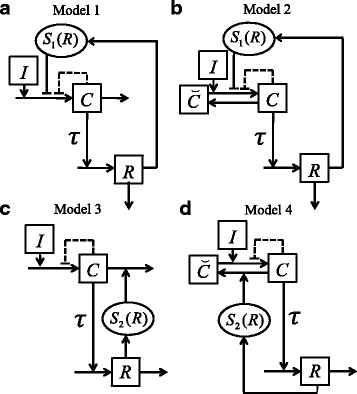
Background: Negative feedback in combination with time delay can bring about both sustained oscillations and adaptive behaviour in cellular networks. Here, we study which design features of systems with delayed negative feedback shape characteristic response patterns with special emphasis on the role of time delay. To this end, we analyse generic two-dimensional delay differential equations describing the dynamics of biochemical signal-response networks.

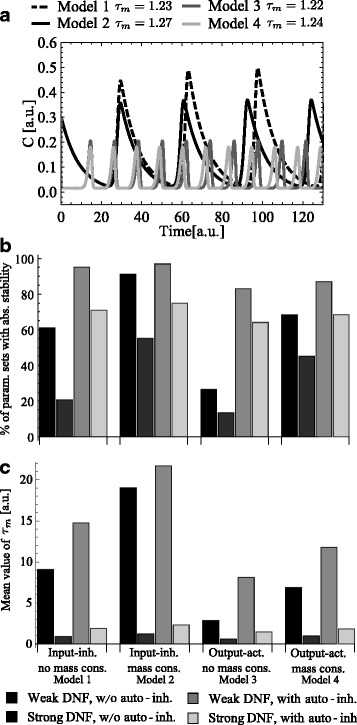
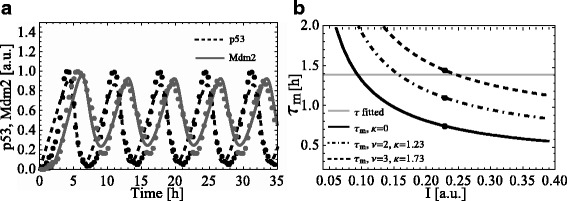
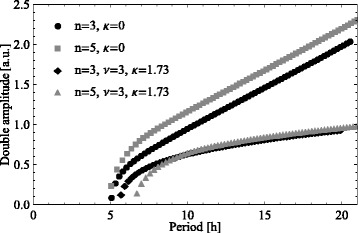
Results: We investigate the influence of several design features on the stability of the model equilibrium, i.e., presence of auto-inhibition and/or mass conservation and the kind and/or strength of the delayed negative feedback. We show that auto-inhibition and mass conservation have a stabilizing effect, whereas increasing abruptness and decreasing feedback threshold have a de-stabilizing effect on the model equilibrium. Moreover, applying our theoretical analysis to the mammalian p53 system we show that an auto-inhibitory feedback can decouple period and amplitude of an oscillatory response, whereas the delayed feedback can not.

Conclusions: Our theoretical framework provides insight into how time delay and design features of biochemical networks act together to elicit specific characteristic response patterns. Such insight is useful for constructing synthetic networks and controlling their behaviour in response to external stimulation.

Keywords: Auto-inhibiton; Bifurcation; Mass conservation; Stability; p53.


Figures

Fig. 1
Fig. 1
Generic signal-response models with DNF. Squares indicate model variables, circles indicate model functions. Arrows between and to components indicate biochemical reactions, arrows on arrows indicate modifying influences and arrows to functions indicate the respective influence on the function. The models differ in design of the delayed negative feedback (DNF) as well as in presence of mass conservation for the component C and auto-inhibitory feedback. a Model with input-inhibition as DNF and without mass conservation. b Model with input-inhibition as DNF and with mass conservation. c Model with output-activation as DNF and without mass conservation. d Model with output-activation as DNF and with mass conservation. In all models the time delay τ is before activation of the response variable R. Dashed lines indicate an alternative auto-inhibitory feedback
Fig. 2
Fig. 2
Results of Monte-Carlo analysis of Models 1-4. a Simulation of Models 1-4 with parameter values I=0.87, α=0.11, β=0.17, δ=58.2, n=12.77, K m=0.23, τ=2.5 without auto-inhibition (κ=0). b,c Stability analysis of Monte-Carlo simulations of Models 1-4. Model parameters were randomly sampled 10000 times in the certain range. The range was defined according to assumptions about model characteristics: strength of DNF (strong or weak) and presence of auto-inhibition. The percentage of parameter sets (see Fig. b), which induced absolute stability, and the mean value of marginal time delay τ m (see Fig. c) were quantified
Fig. 3
Fig. 3
Simulation and response analysis of the p53 model. a Simulation of the p53 model (3) with fitted parameters from Table S1 (see Additional file 1), dots – experimental data from [30], Fig. S6 therein. b Dependence between the stimulus value I and τ m for the p53 model (3) with fitted parameters from Table S1 (see Additional file 1) without and with synthetically activated auto-inhibitory feedback F(C) (with ν=2, κ=1.23 and ν=3, κ=1.73). Dots designate values of τ m calculated for the fitted value of I=0.23 for the p53 model (3) with and without auto-inhibitory feedback
Fig. 4
Fig. 4
Amplitude/period curves of the p53 model under variation of τ. The analysis is performed for the p53 model (3) without and with synthetically activated (ν=2, κ=1.23; ν=3, κ=1.73) auto-inhibitory feedback using values of the Hill coefficient n=3 and n=5 (fitted value) of the DNF function S 2. Period and amplitude were quantified for the time delay τ varied in the range from 1 to 8 hours with the step 0.2 hour. Both amplitude and period of oscillations increase with τ

Similar articles

Cited by

References

    1. Alon U. An Introduction to Systems Biology: Design Principles of Biological Circuits. Boca Raton: Chapman & Hall/CRC; 2006.
    1. Alon U. Network motifs: theory and experimental approaches. Nat Rev Genet. 2007;8(6):450–61. doi: 10.1038/nrg2102. - DOI - PubMed
    1. Legewie S, Herzel H, Westerhoff HV, Blüthgen N. Recurrent design patterns in the feedback regulation of the mammalian signalling network. Mol Syst Biol. 2008;4:190. doi: 10.1038/msb.2008.29. - DOI - PMC - PubMed
    1. Kholodenko BN, Hancock JF, Kolch W. Signalling ballet in space and time. Nat Rev Mol Cell Biol. 2010;11(6):414–26. doi: 10.1038/nrm2901. - DOI - PMC - PubMed
    1. Tyson JJ, Chen KC, Novak B. Sniffers, buzzers, toggles and blinkers: dynamics of regulatory and signaling pathways in the cell. Curr Opin Cell Biol. 2003;15(2):221–31. doi: 10.1016/S0955-0674(03)00017-6. - DOI - PubMed

Publication types

MeSH terms

Substances