. 2016 Aug 25:6:31479.
doi: 10.1038/srep31479.

Pancreas-enriched miRNAs are altered in the circulation of subjects with diabetes: a pilot cross-sectional study

Affiliations

Pancreas-enriched miRNAs are altered in the circulation of subjects with diabetes: a pilot cross-sectional study

Attila A Seyhan et al. Sci Rep. .

Abstract

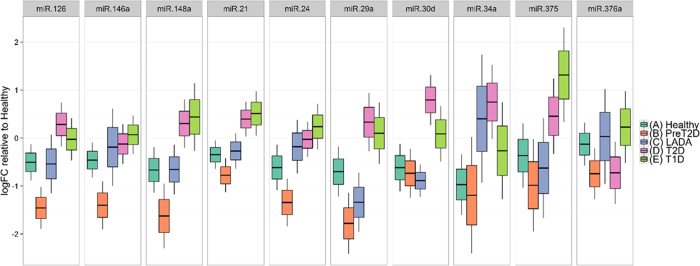
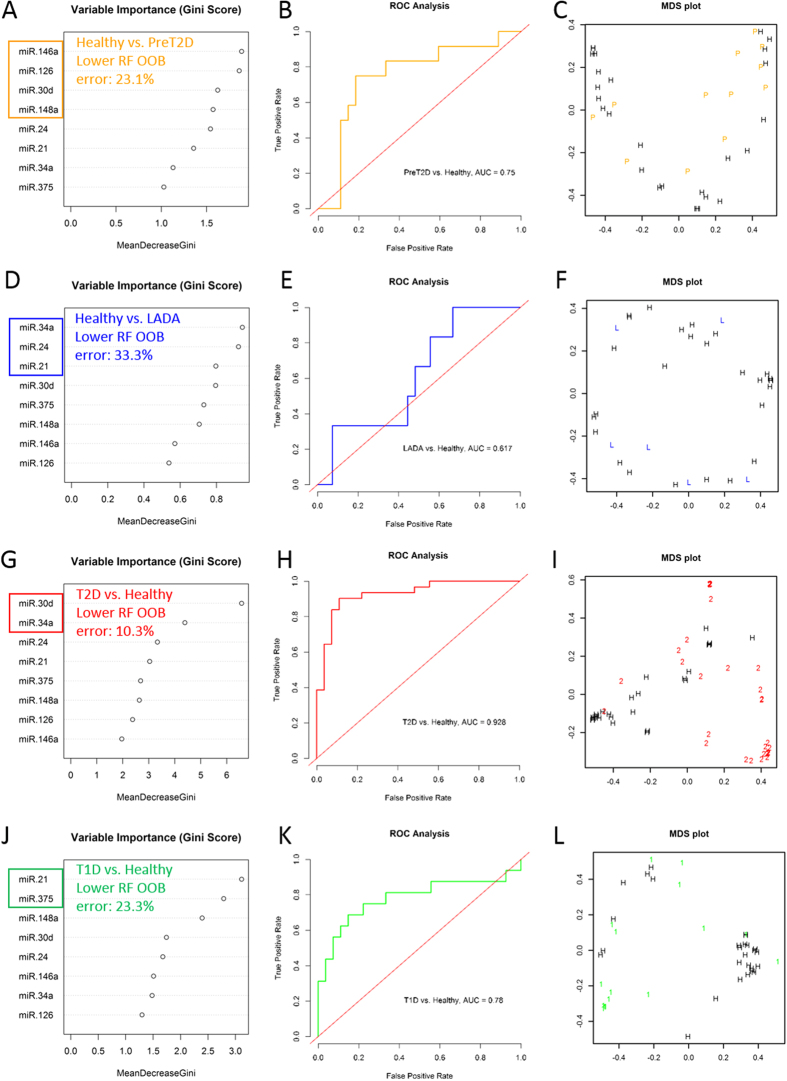
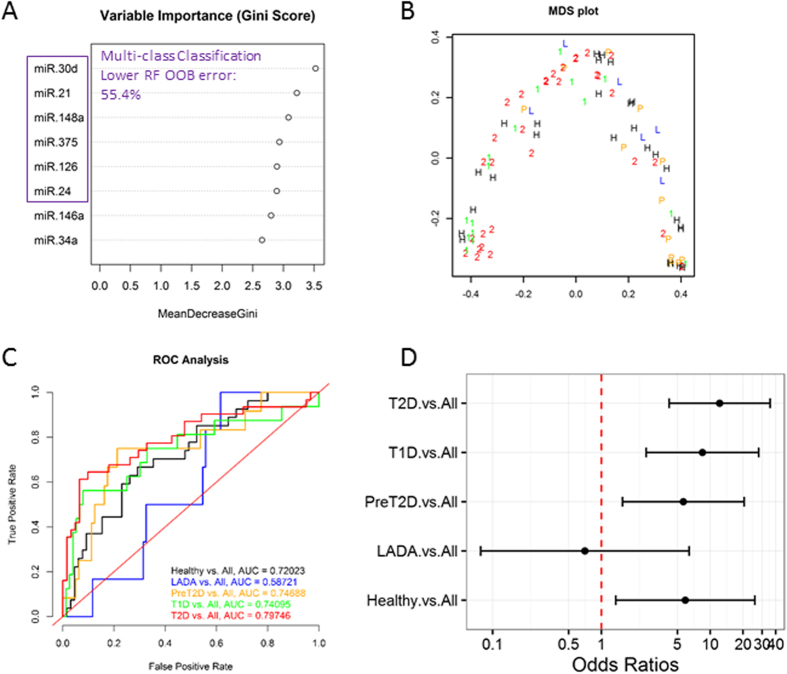
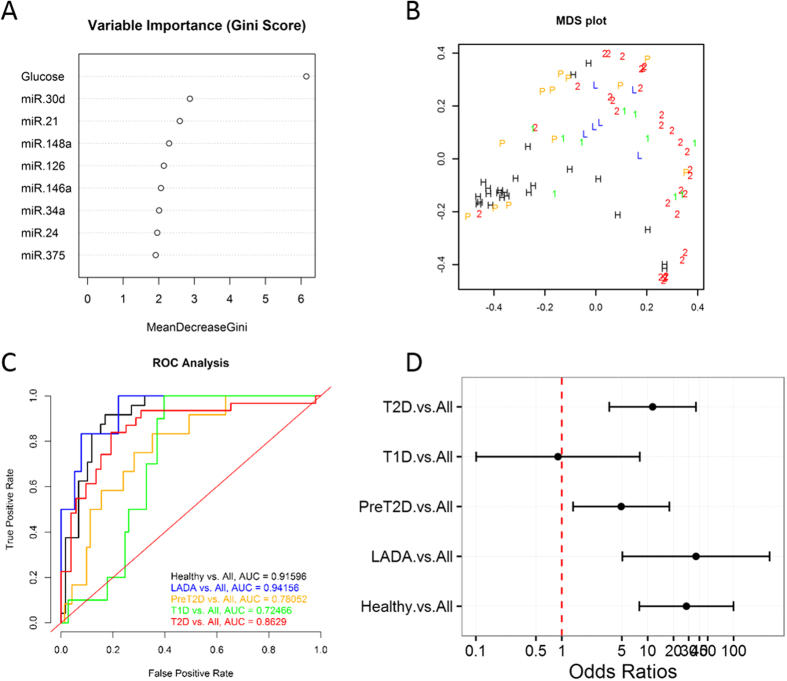
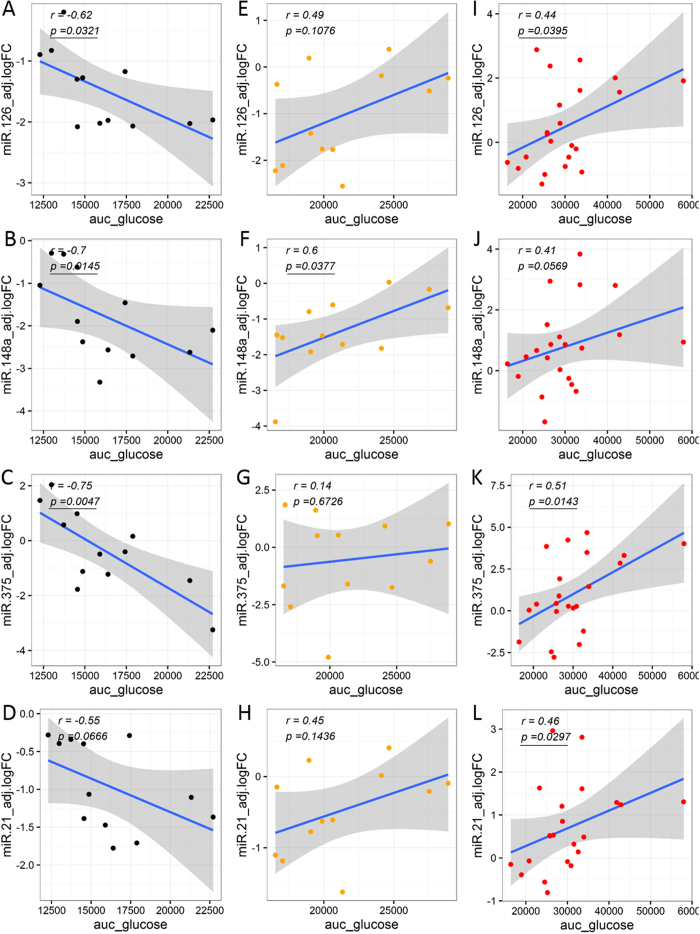
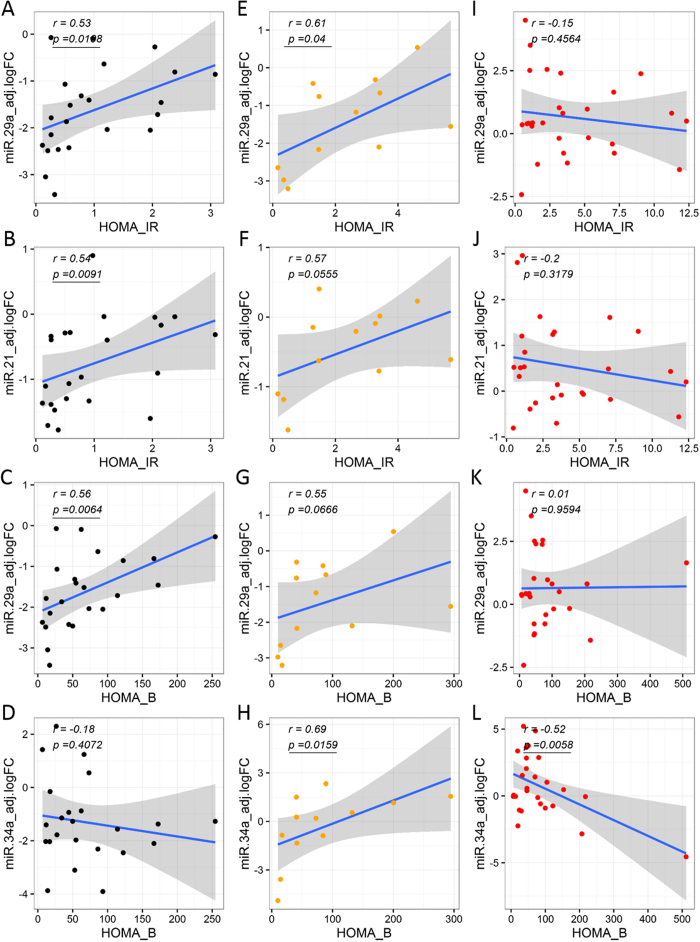
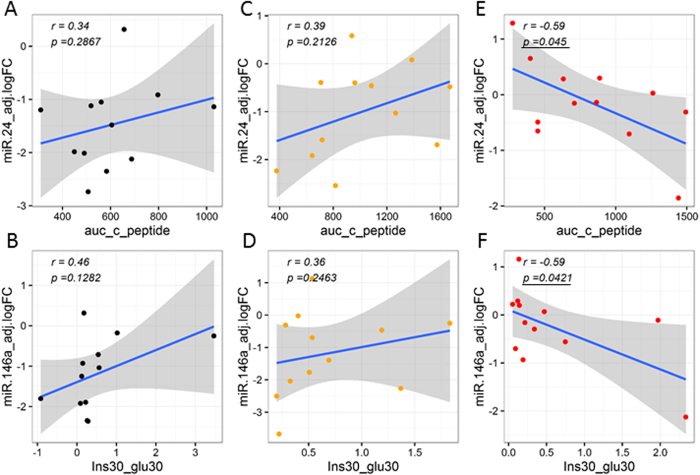
The clinical presentation of diabetes sometimes overlaps, contributing to ambiguity in the diagnosis. Thus, circulating pancreatic islet-enriched microRNAs (miRNAs) might be useful biomarkers of β-cell injury/dysfunction that would allow more accurate subtyping of diabetes. We measured plasma levels of selected miRNAs in subjects with prediabetes (n = 12), type 2 diabetes (T2D, n = 31), latent autoimmune diabetes of adults (LADA, n = 6) and type 1 diabetes (T1D, n = 16) and compared them to levels in healthy control subjects (n = 27). The study was conducted at the Translational Research Institute for Metabolism and Diabetes (TRI-MD), Florida Hospital. MiRNAs including miR-375 (linked to β-cell injury), miR-21 (associated with islet inflammation), miR-24.1, miR-30d, miR-34a, miR-126, miR-146, and miR-148a were significantly elevated in subjects with various forms of diabetes compared to healthy controls. Levels of several miRNAs were significantly correlated with glucose responses during oral glucose tolerance testing, HbA1c, β-cell function, and insulin resistance in healthy controls, prediabetes, and T2D. These data suggest that miRNAs linked to β-cell injury and islet inflammation might be useful biomarkers to distinguish between subtypes of diabetes. This information could be used to predict progression of the disease, guide selection of optimal therapy and monitor responses to interventions, thus improving outcomes in patients with diabetes.


Figures

Figure 1
Figure 1. Circulating levels of pancreas-enriched miRNAs in subjects with different types of diabetes.
The prediabetes group showed significant reduced levels of miR-126 and miR-146a (p < 0.05, FDR < 0.15). The group with type 2 diabetes exhibited significantly elevated levels of circulating miR-30d, miR-34a, miR-21, and miR148a (p < 0.05, FDR < 0.1). The group with T1D exhibited significantly higher levels of miR-21, miR-375 (associated with β-cell death), miR-148a, and miR-24.1 (associated with islet-inflammation) (p < 0.05, FDR < 0.05). The fold change for every miRNA was obtained using the 2−∆∆Ct method with the geometric mean of two endogenous control miRNAs (hsa-miR-191 and miR-451) for normalization. The data are presented as log fold-change ± SEM (box) and the 95% confidence interval (whiskers). The limma R package was used to assess the statistical significance of miRNA differential abundance in circulation. Data was adjusted for confounding variables: BMI, age, and gender. Statistical significance was considered at p-value < 0.05. Corresponding p and adjusted p-values are reported in Table 2.
Figure 2
Figure 2. Binary RF classification of diabetes subtypes versus Healthy designation.
Random Forest (RF) classification was performed in the R environment using the randomForest package. Data used was BMI, age, and gender-adjusted logFC for differentially abundant circulating miRNAs and the clinical designation (class label) of each individual [i.e., Healthy, Prediabetes, LADA, T2D, and T1D]. Four sets of binary classifications were conducted, one for each diabetes subtype as compared to Healthy control group. (AC) shows the results for Prediabetes vs. Healthy classification. (DF) shows the results for LADA vs. Healthy classification. (GI) shows the results for T2D vs. Healthy classification. (JL) shows the results for the T1D vs. Healthy classification. Left panels display the variable importance plot (Gini scores) determined during the initial binary RF classification including all 8 differentially abundant circulating miRNAs. This order of variable importance was used to recursively repeat the RF classification including the top 2, 3, and so forth combinations of miRNAs as predictor variables, and identify the binary classifier with the lower out-of-bag (OOB) estimate of error rate. Outline-colored boxes enclose the combination of miRNAs that generated the classifier with the lower OOB error rate (reported in the top left corner of each left panel graph). The middle panels display the Receiver Operator Characteristic (ROC) Curve generated for sensitivity analysis using the ROCR package. The RF prediction probabilities were used for the generation of the ROCR prediction object. The area under the curve (AUC) is reported as performance measure. The right panels display the multidimensional scaling (MDS) plots for each respective binary RF classification. Color and symbol coding: black and H: Healthy group; orange, P, and PreT2D: Prediabetes group; blue and L: LADA group; red and 2: T2D group; green and 1: T1D group.
Figure 3
Figure 3. Multi-class RF classification of diabetes subtypes.
Random Forest (RF) classification was performed in the R environment using the randomForest package. Data used was BMI, age, and gender-adjusted logFC for differentially abundant circulating miRNAs and the clinical designation (class label) of each individual [i.e., Healthy, Prediabetes, LADA, T2D, and T1D]. (A) Variable importance plot (Gini scores) determined during the initial multi-class RF classification including all 8 differentially abundant circulating miRNAs. This order of variable importance was used to recursively repeat the RF classification including the top 2, 3, and so forth combinations of miRNAs as predictor variables, and identify the binary classifier with the lower out-of-bag (OOB) estimate of error rate. Outline-colored box encloses the combination of miRNAs that generated the classifier with the lower OOB error rate (reported in the top left corner). (B) Multidimensional scaling (MDS) plot generated for the multi-class RF classifier that included the top 6 miRNAs and performed with the lower OOB estimate of error rate. (C) Receiver Operator Characteristic (ROC) Curves generated by plotting the classifier true positive rate (sensitivity) as a function of the false positive rate (1-specificity). The multi-class RF prediction probabilities were used for the generation of ROCR prediction objects. The 5-class classification problem was reformulated as five one-versus-all (OVA) binary comparisons. The area under the curve (AUC) is reported as performance measure. (D) Diagnostic Odds Ratios calculated for each OVA comparison using the formula DOR = (TP/FN)/(FP/TN), where TP is the number of true positives, FN, the number of false negatives, FP, the number of false positives, and TN, the number of true negatives. DOR of a test is a single indicator of diagnostic performance and represents the odds of positivity in individuals with the disease relative to the odds of positivity in individuals without the disease. Color and symbol coding: black and H: Healthy group; orange, P, and PreT2D: Prediabetes group; blue and L: LADA group; red and 2: T2D group; green and 1: T1D group.
Figure 4
Figure 4. Multimodal multi-class RF classification of diabetes subtypes.
Description of this figure is the same as for Fig. 3, with the only difference that the baseline glucose level was included as a predictor variable in addition to circulating miRNA levels.
Figure 5
Figure 5. Differential associations between circulating miRNA levels and clinical measure of glycemic control (glucose AUC).
Correlation analyses were performed by calculating partial correlation coefficients between clinical parameters and circulating miRNA logFC levels adjusted for BMI, age, and gender. Left panels (A–D) show correlation plots for the Healthy group (black dots). Middle panels (E–H) show correlation plots for the Prediabetes group (orange dots). Right panels (I–L) show correlation plots for the T2D group (red dots). Blue line represent the linear fit of the plotted points, shown for visualization purposes (gray band represent the associated 95% confidence interval of the fit). Partial correlation coefficient (r) reported in top left corner of each plot. Statistical significance was considered at p-value < 0.05 (bold and underline text in left top corner of plot).
Figure 6
Figure 6. Differential associations between circulating miRNA levels and clinical indices of insulin sensitivity and β-cell function (HOMA IR, HOMA B).
Correlation analyses were performed by calculating partial correlation coefficients between clinical parameters and circulating miRNA logFC levels adjusted for BMI, age, and gender. Left panels (A–D) show correlation plots for the Healthy group (black dots). Middle panels (E–H) show correlation plots for the Prediabetes group (orange dots). Right panels (I–L) show correlation plots for the T2D group (red dots). Blue line represent the linear fit of the plotted points, shown for visualization purposes (gray band represent the associated 95% confidence interval of the fit). Partial correlation coefficient (r) reported in top left corner of each plot. Statistical significance was considered at p-value < 0.05 (bold and underline text in left top corner of plot).
Figure 7
Figure 7. Differential associations between circulating miRNA levels and clinical indices of β-cell function (Insulinogenic index and c-peptide AUC).
Correlation analyses were performed by calculating partial correlation coefficients between clinical parameters and circulating miRNA logFC levels adjusted for BMI, age, and gender. Left panels (A–D) show correlation plots for the Healthy group (black dots). Middle panels (E–H) show correlation plots for the Prediabetes group (orange dots). Right panels (I–L) show correlation plots for the T2D group (red dots). Blue line represent the linear fit of the plotted points, shown for visualization purposes (gray band represent the associated 95% confidence interval of the fit). Partial correlation coefficient (r) reported in top left corner of each plot. Statistical significance was considered at p-value p < 0.05 (bold and underline text in left top corner of plot).

References

    1. Tuomi T. et al. The many faces of diabetes: a disease with increasing heterogeneity. Lancet 383, 1084–1094 (2014). - PubMed
    1. Seyhan A. A. microRNAs with different functions and roles in disease development and as potential biomarkers of diabetes: progress and challenges. Mol Biosyst 11, 1217–1234 (2015). - PubMed
    1. Carini C. & Seyhan A. A. In Clinical and Statistical Considerations in Personalized Medicine (eds Carini C. et al.) Ch. 1, 1–26 (CRC Press, 2014).
    1. Ziegler A. G. et al. Seroconversion to multiple islet autoantibodies and risk of progression to diabetes in children. JAMA 309, 2473–2479 (2013). - PMC - PubMed
    1. Zampetaki A. & Mayr M. MicroRNAs in vascular and metabolic disease. Circ Res 110, 508–522 (2012). - PubMed

Publication types

MeSH terms