. 2016 Aug 25:6:31731.
doi: 10.1038/srep31731.

A robust ambient temperature collection and stabilization strategy: Enabling worldwide functional studies of the human microbiome

Affiliations

A robust ambient temperature collection and stabilization strategy: Enabling worldwide functional studies of the human microbiome

Ericka L Anderson et al. Sci Rep. .

Abstract

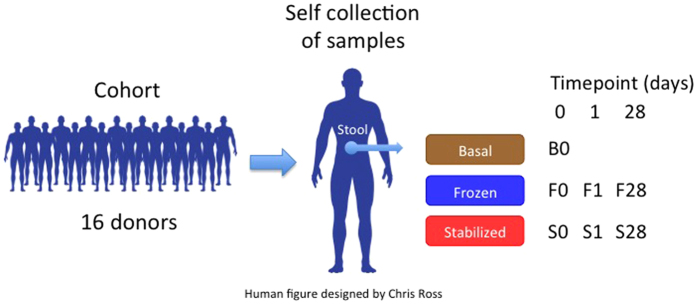
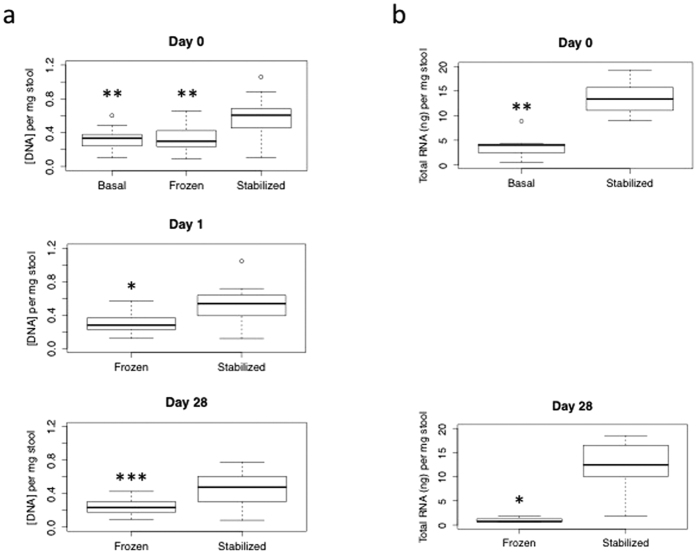
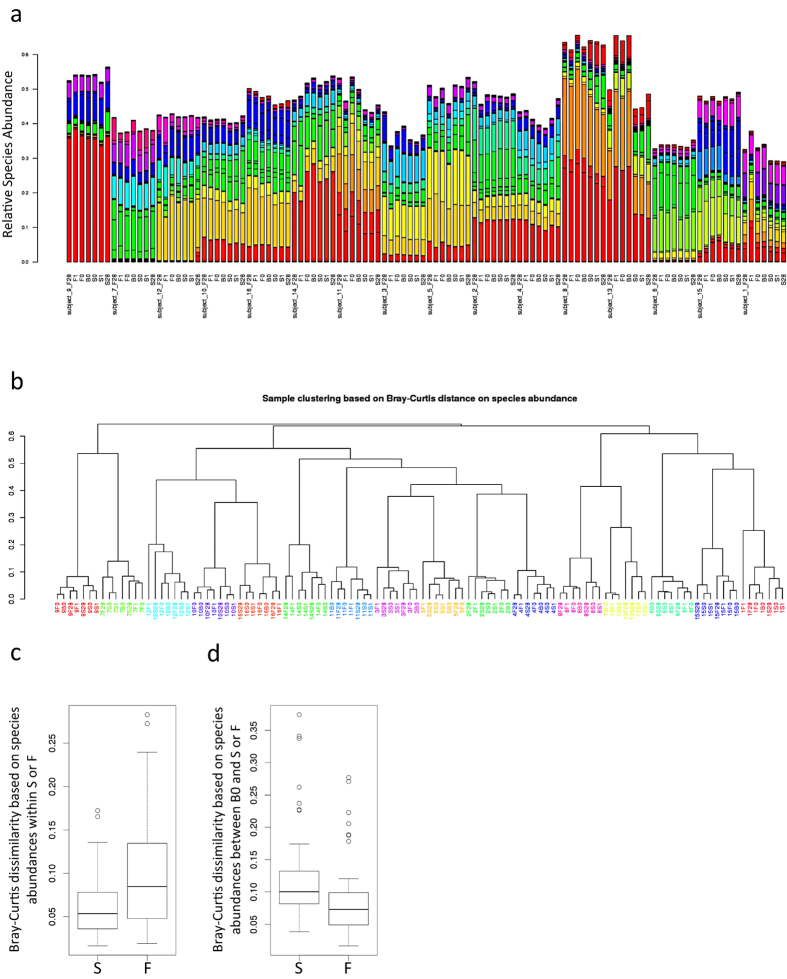
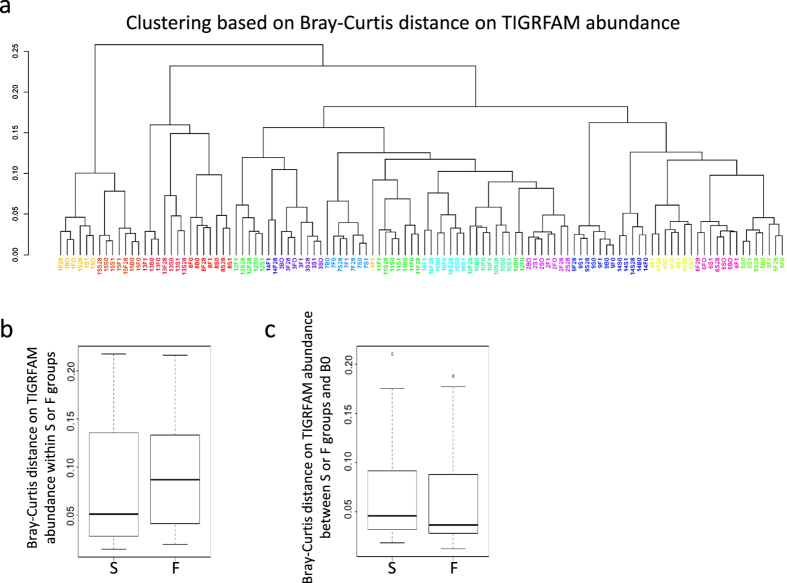
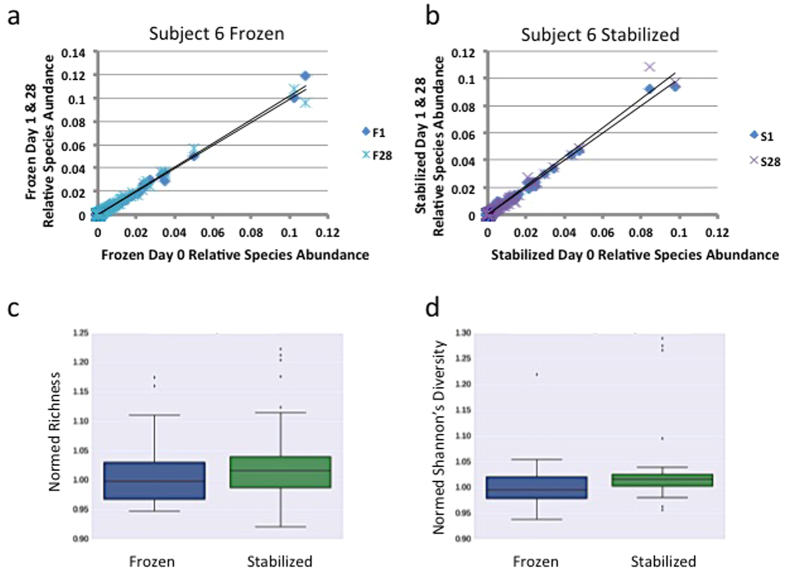
As reports on possible associations between microbes and the host increase in number, more meaningful interpretations of this information require an ability to compare data sets across studies. This is dependent upon standardization of workflows to ensure comparability both within and between studies. Here we propose the standard use of an alternate collection and stabilization method that would facilitate such comparisons. The DNA Genotek OMNIgene∙Gut Stool Microbiome Kit was compared to the currently accepted community standard of freezing to store human stool samples prior to whole genome sequencing (WGS) for microbiome studies. This stabilization and collection device allows for ambient temperature storage, automation, and ease of shipping/transfer of samples. The device permitted the same data reproducibility as with frozen samples, and yielded higher recovery of nucleic acids. Collection and stabilization of stool microbiome samples with the DNA Genotek collection device, combined with our extraction and WGS, provides a robust, reproducible workflow that enables standardized global collection, storage, and analysis of stool for microbiome studies.


Figures

Figure 1
Figure 1. Experimental Design.
A cohort of 16 volunteer donors was recruited for self collection of stool microbiome samples. Stool samples were aliquoted into Basal, Frozen, and Stabilized aliquots with time points taken as marked.
Figure 2
Figure 2. Stabilized samples have increased nucleic acid yields.
Box whisker plots of yields of (a) DNA (ng/μl) per mg stool input on Day 0, Day 1, and Day 28. (b) Total RNA (ng)/mg stool input at Day 0 and Day 28. Day 28 RNA Frozen (N = 5). Wilcoxon Rank Sum Test: *p-value < 0.01, **p-value < 0.001, ***p-value < 0.0001.
Figure 3
Figure 3. Stabilized samples are consistent with Frozen and Basal samples.
(a) Relative species abundances of the top 30 species across all 16 subjects were plotted for each individual sample from each subject. (b) Bray-Curtis dissimilarity based on relative species abundances was used to cluster all samples. Each color represents a distinct subject. (c) Box and whisker plots of calculated pairwise Bray-Curtis dissimilarity within either Frozen or Stabilized. (d) Box and whisker plots of calculated pairwise Bray-Curtis dissimilarity between Basal and either Frozen or Stabilized. B0: Basal; F0, F1, F28: Frozen Day 0, Day 1, and Day 28; S0, S1, S28: Stabilized Day 0, Day 1, and Day 28; F: Frozen; S: Stabilized.
Figure 4
Figure 4. Stabilized samples maintain results of TIGRFAM analysis.
(a) Bray-Curtis distances based on relative TIGRFAM abundances were used to cluster all samples. Each color represents a distinct subject. (b) Box and whisker plots of calculated pairwise Bray-Curtis dissimilarity within either Frozen or Stabilized. (c) Box and whisker plots of calculated pairwise Bray-Curtis dissimilarity between Basal and either Frozen or Stabilized. B0: Basal; F0, F1, F28: Frozen Day 0, Day 1, and Day 28; S0, S1, S28: Stabilized Day 0, Day 1, and Day 28; F: Frozen; S: Stabilized.
Figure 5
Figure 5. Stabilized and Frozen samples are reproducible.
Precision analysis of (a) Frozen Day 0 relative species abundances plotted against corresponding Frozen Day 1 and Day 28 relative species abundances in representative subject 6, (b) Stabilized Day 0 relative species abundances plotted against corresponding Stabilized Day 1 and Day 28 relative species abundances in representative subject 6. Black line = linear regression analysis. R2 values for all subjects are in Table 2. (c) Boxplot of normalized Frozen and Stabilized richness scores across all subjects and time points. (d) Boxplot of normalized Frozen and Stabilized diversity (SDI) scores across all subjects and time points.

References

    1. Turnbaugh P. J. et al. A core gut microbiome in obese and lean twins. Nature 457, 480–484, 10.1038/nature07540 (2009). - DOI - PMC - PubMed
    1. Qin J. et al. A metagenome-wide association study of gut microbiota in type 2 diabetes. Nature 490, 55–60, 10.1038/nature11450 (2012). - DOI - PubMed
    1. Marchesi J. R. et al. Towards the human colorectal cancer microbiome. PLoS One 6, e20447, 10.1371/journal.pone.0020447 (2011). - DOI - PMC - PubMed
    1. Zackular J. P., Rogers M. A., Ruffin M. T. t. & Schloss P. D. The human gut microbiome as a screening tool for colorectal cancer. Cancer Prev Res (Phila) 7, 1112–1121, 10.1158/1940-6207.CAPR-14-0129 (2014). - DOI - PMC - PubMed
    1. Farrokhi V. et al. Bacterial lipodipeptide, Lipid 654, is a microbiome-associated biomarker for multiple sclerosis. Clin Transl Immunology 2, e8, 10.1038/cti.2013.11 (2013). - DOI - PMC - PubMed

Publication types