. 2016 Dec 15;32(24):3729-3734.
doi: 10.1093/bioinformatics/btw526. Epub 2016 Aug 24.

Assembly-based inference of B-cell receptor repertoires from short read RNA sequencing data with V'DJer

Affiliations

Assembly-based inference of B-cell receptor repertoires from short read RNA sequencing data with V'DJer

Lisle E Mose et al. Bioinformatics. .

Abstract

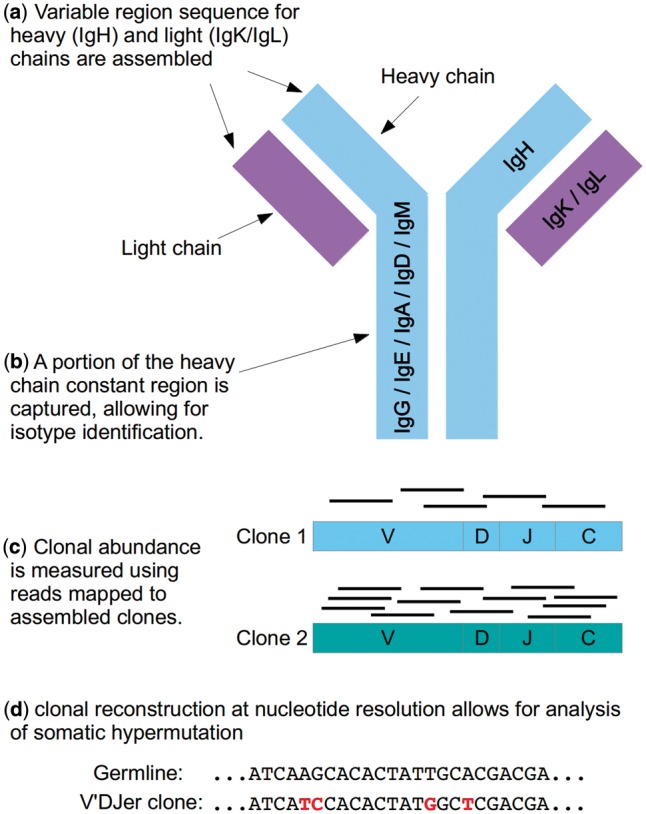
Motivation: B-cell receptor (BCR) repertoire profiling is an important tool for understanding the biology of diverse immunologic processes. Current methods for analyzing adaptive immune receptor repertoires depend upon PCR amplification of VDJ rearrangements followed by long read amplicon sequencing spanning the VDJ junctions. While this approach has proven to be effective, it is frequently not feasible due to cost or limited sample material. Additionally, there are many existing datasets where short-read RNA sequencing data are available but PCR amplified BCR data are not.

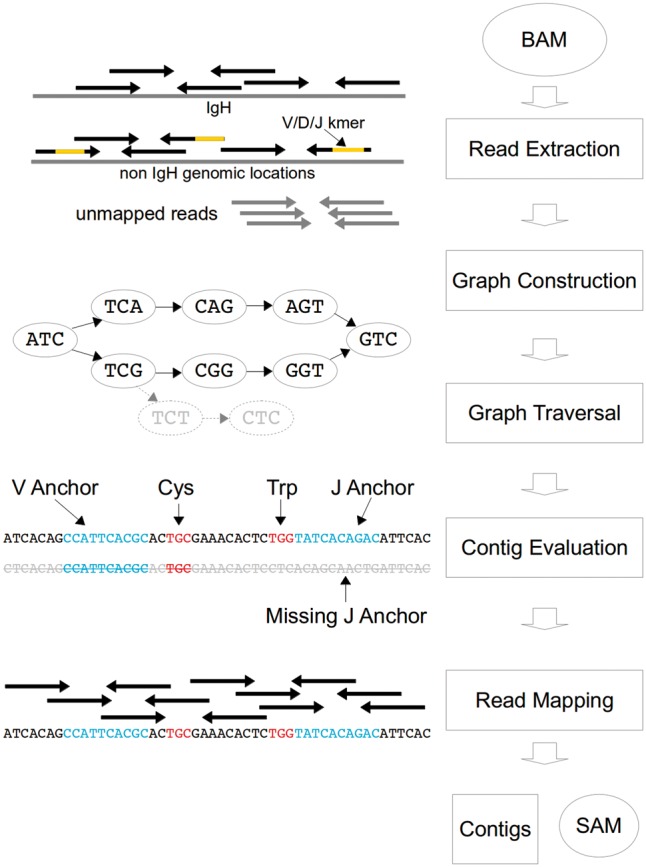
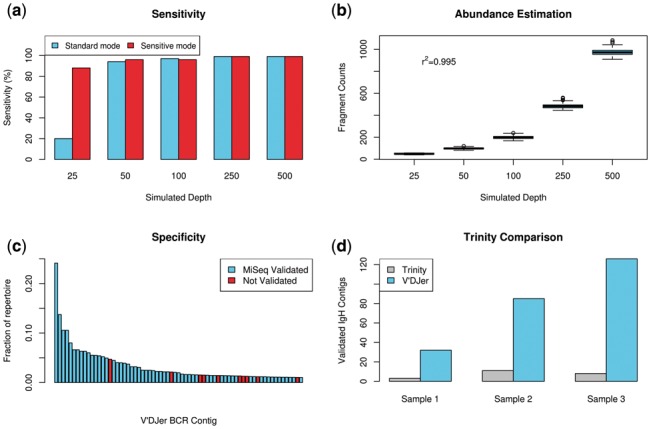
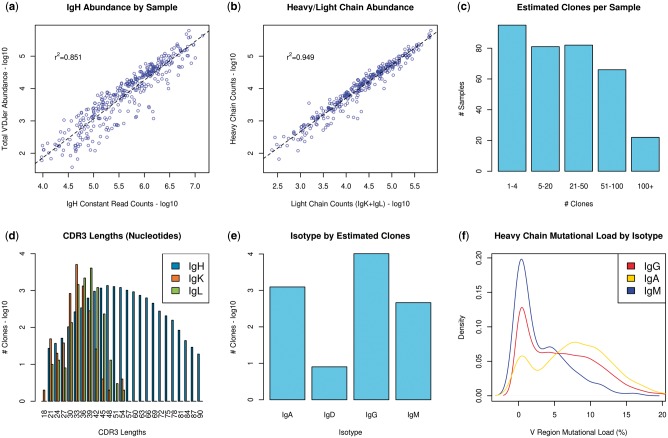
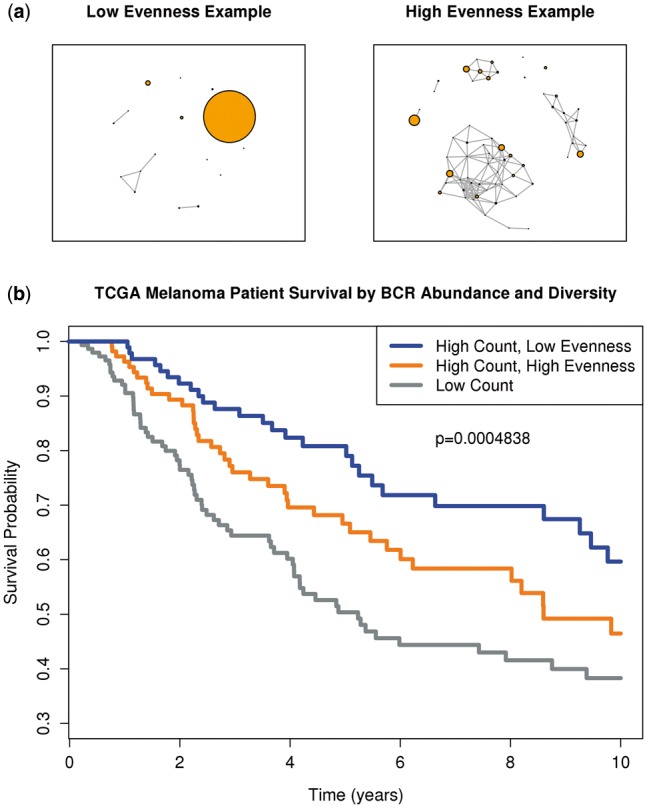
Results: We present here V'DJer, an assembly-based method that reconstructs adaptive immune receptor repertoires from short-read RNA sequencing data. This method captures expressed BCR loci from a standard RNA-seq assay. We applied this method to 473 Melanoma samples from The Cancer Genome Atlas and demonstrate V'DJer's ability to accurately reconstruct BCR repertoires from short read mRNA-seq data.

Availability and implementation: V'DJer is implemented in C/C ++, freely available for academic use and can be downloaded from Github: https://github.com/mozack/vdjer CONTACT: benjamin_vincent@med.unc.edu or parkerjs@email.unc.eduSupplementary information: Supplementary data are available at Bioinformatics online.


Figures

Fig. 1.
Fig. 1.
V’DJer features. (a) BCR light and heavy chains can be assembled from a single assay. (b) The isotype of an assembled heavy chain can be identified using the assembled constant region sequence. (c) Relative clone abundance can be accurately measured using reads mapped to assembled clones. (d) Nucleotide resolution assembly provides the ability to perform mutation specific analyses including somatic hypermutation assessment and clonal diversity of the sample
Fig. 2.
Fig. 2.
V’DJer workflow. V’DJer accepts a mapped mRNA-seq BAM file as input. Reads mapping to or having homology with Ig chain specific loci or sequence are extracted along with all unmapped reads and are used to construct a deBruijn graph. The graph is traversed producing putative contigs which are filtered based upon the presence of sequence having homology with anchors arising from germline V and J segments as well as conserved amino acids and read coverage. The final set of assembled contigs spanning most of the V(D)J region and a portion of the constant region is output along with a SAM file of reads mapped to the assembled contigs
Fig. 3.
Fig. 3.
Performance characteristics. (a) Evaluation of ability to detect simulated IgH sequences by depth of sequencing. (b) Quantification results from simulated data show that relative abundance measured by RSEM for clones of varying depths closely matches expectation. (c) Assembled contigs validated by MiSeq sequencing sorted by relative abundance. All contigs comprising at least 1% of the IgH repertoire for a given sample are shown. (d) Assembled IgH contigs validated by MiSeq sequencing for Trinity and V’DJer
Fig. 4.
Fig. 4.
TCGA melanoma results. (a) Total V’DJer abundance measured against reads mapped to IgH constant regions. (b) V’DJer heavy chain abundance is associated with V’Djer light chain abundance. (c) Number of assembled clones per sample. (d) CDR3 length distributions for all assembled contigs (inclusive of conserved Cys and Trp/Phe). (e) Relative abundance of isotype assignments. (f) Isotype specific mutational loads
Fig. 5.
Fig. 5.
Impact of BCR abundance and diversity on survival. (a) Examples of low evenness and high evenness in clone abundance. Larger nodes indicate higher clone abundance. Edges were drawn if Hamming distance is<30% between two sequences. (b) Kaplan–Meier survival curves for the TCGA Melanoma cohort stratified by BCR abundance (high: count>1000, low: count≤1000) and clone evenness (high:>0.8, low: ≤0.8) into three groups: low abundance, high abundance/high evenness and high abundance/low evenness

References

    1. Arstila T.P. et al. (1999) A direct estimate of the human alphabeta T cell receptor diversity. Science, 286, 958–961. - PubMed
    1. Ben-Bassat I., Chor B. (2016) CRISPR detection from short reads using partial overlap graphs. J. Comput. Biol., 23, 461–471. - PubMed
    1. Blachly J.S. et al. (2015) Immunoglobulin transcript sequence and somatic hypermutation computation from unselected RNA-seq reads in chronic lymphocytic leukemia. Proc. Natl. Acad. Sci. USA, 112, 4322–4327. - PMC - PubMed
    1. Boyd S.D. et al. (2009) Measurement and clinical monitoring of human lymphocyte clonality by massively parallel VDJ pyrosequencing. Sci. Transl. Med., 1, 12ra23. - PMC - PubMed
    1. Cancer Genome Atlas Network (2015) Genomic classification of cutaneous melanoma. Cell, 161, 1681–1696. - PMC - PubMed

Substances