. 2017 Feb:180:37-52.e2.
doi: 10.1016/j.trsl.2016.07.023. Epub 2016 Aug 4.

Use of a mouse model to identify a blood biomarker for IFNγ activity in pediatric secondary hemophagocytic lymphohistiocytosis

Affiliations

Use of a mouse model to identify a blood biomarker for IFNγ activity in pediatric secondary hemophagocytic lymphohistiocytosis

Vanessa Buatois et al. Transl Res. 2017 Feb.

Abstract

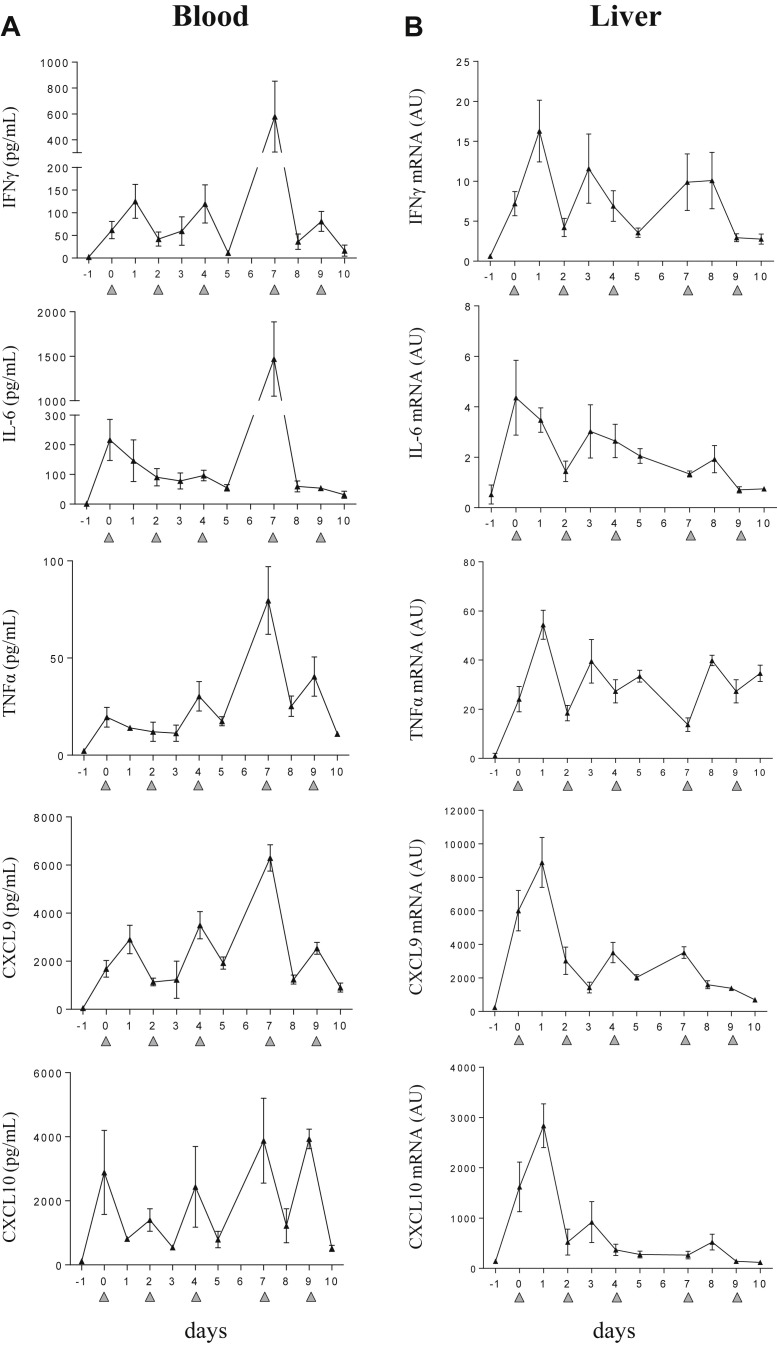
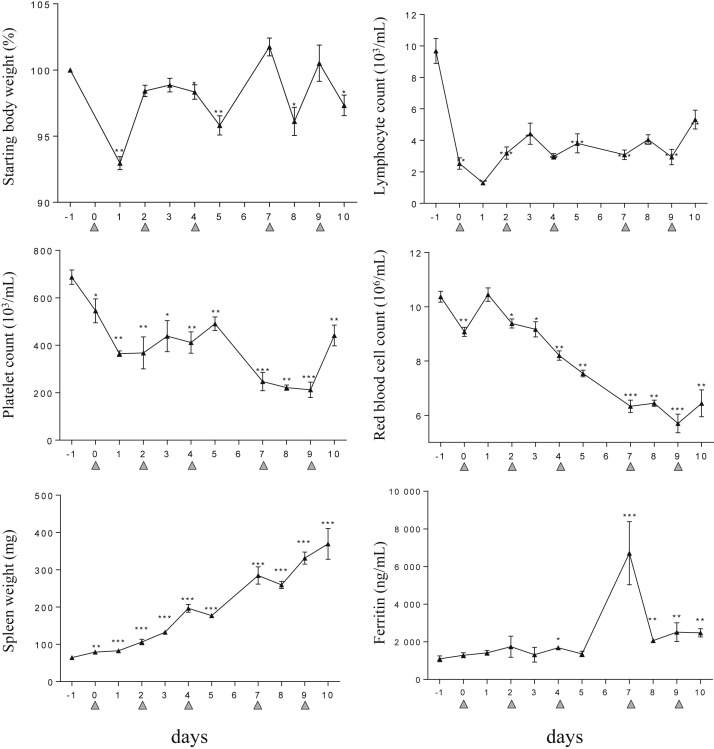
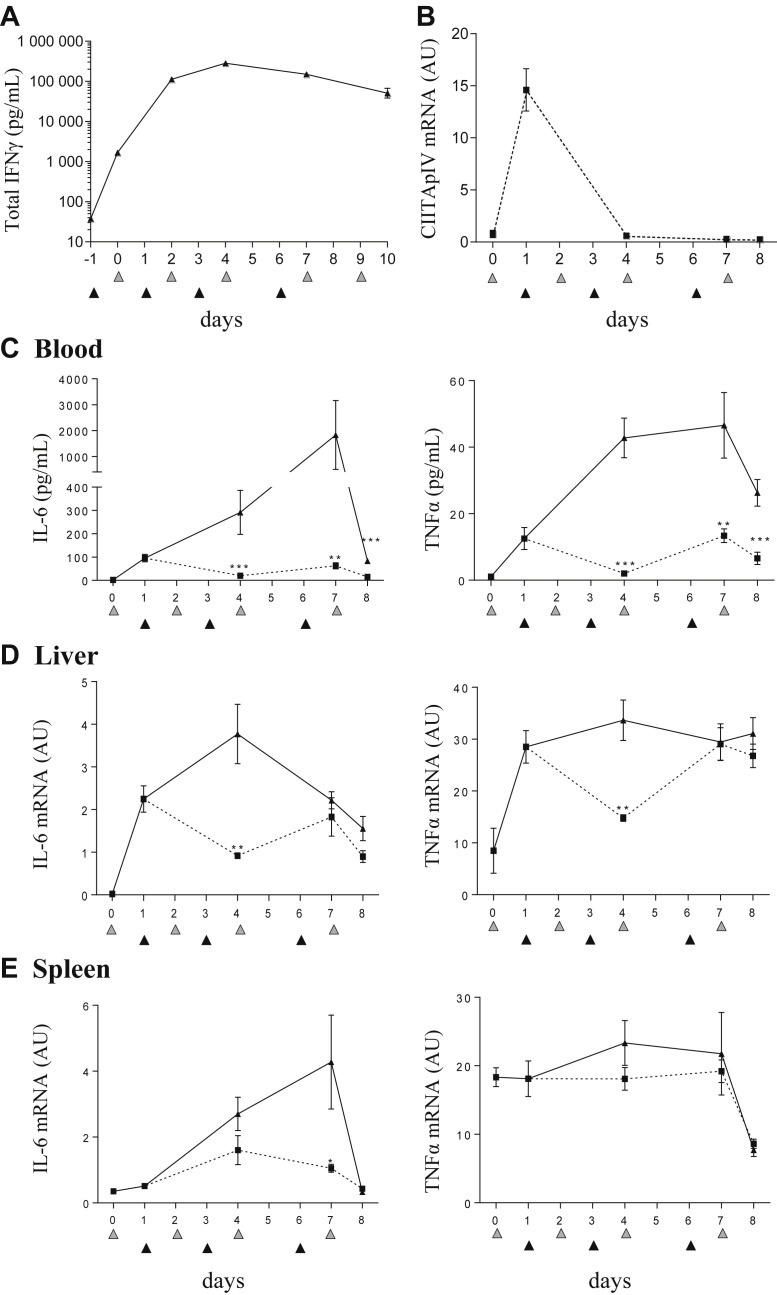
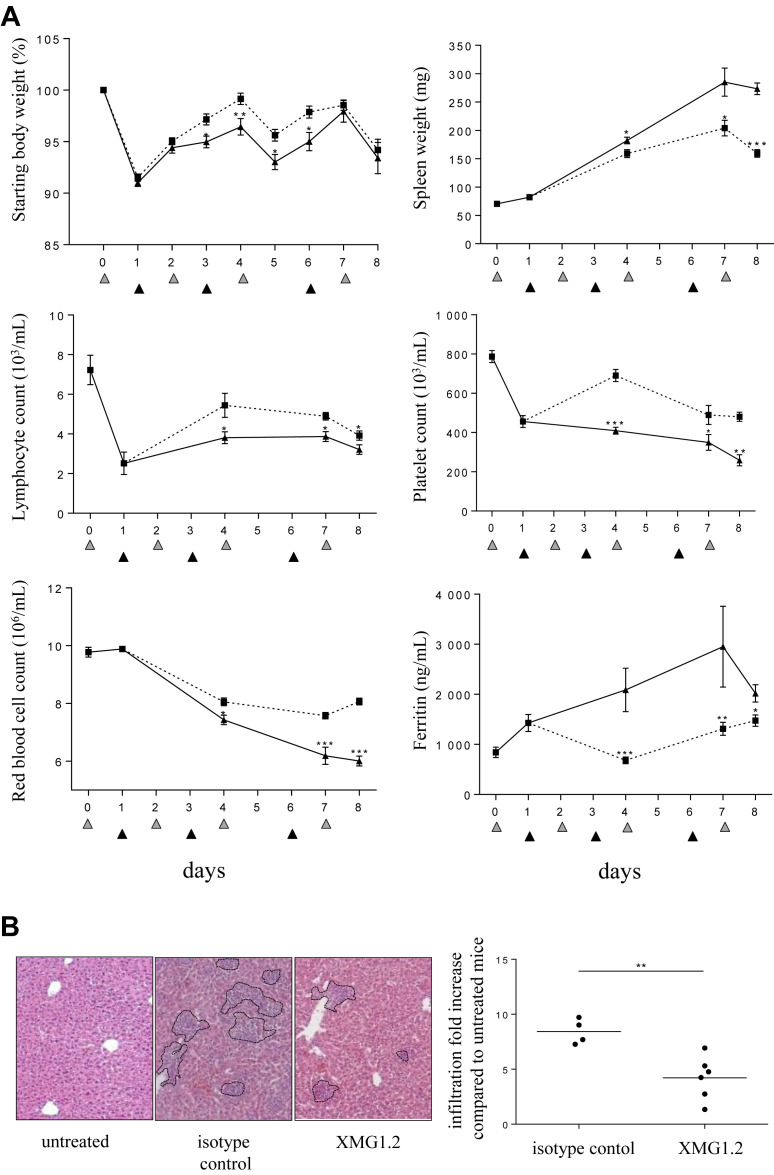
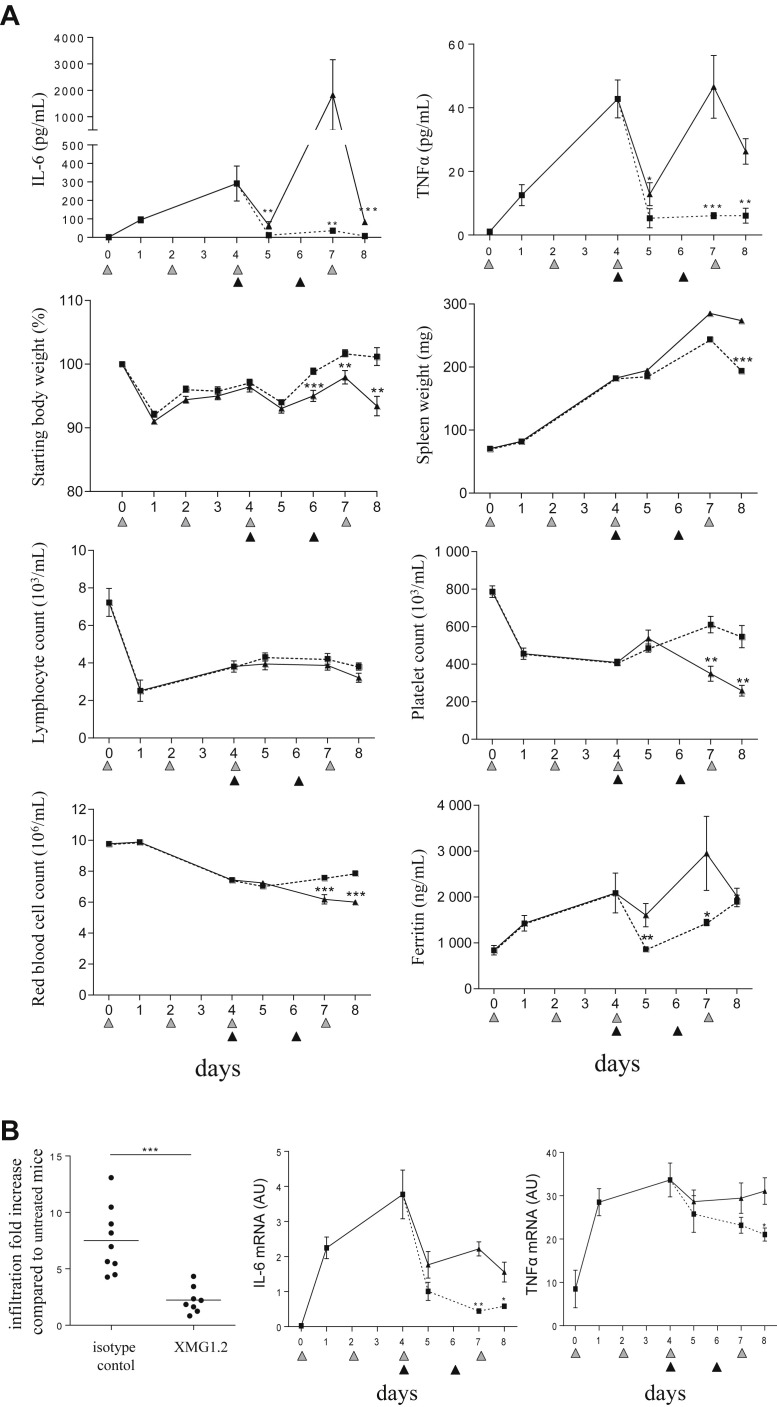
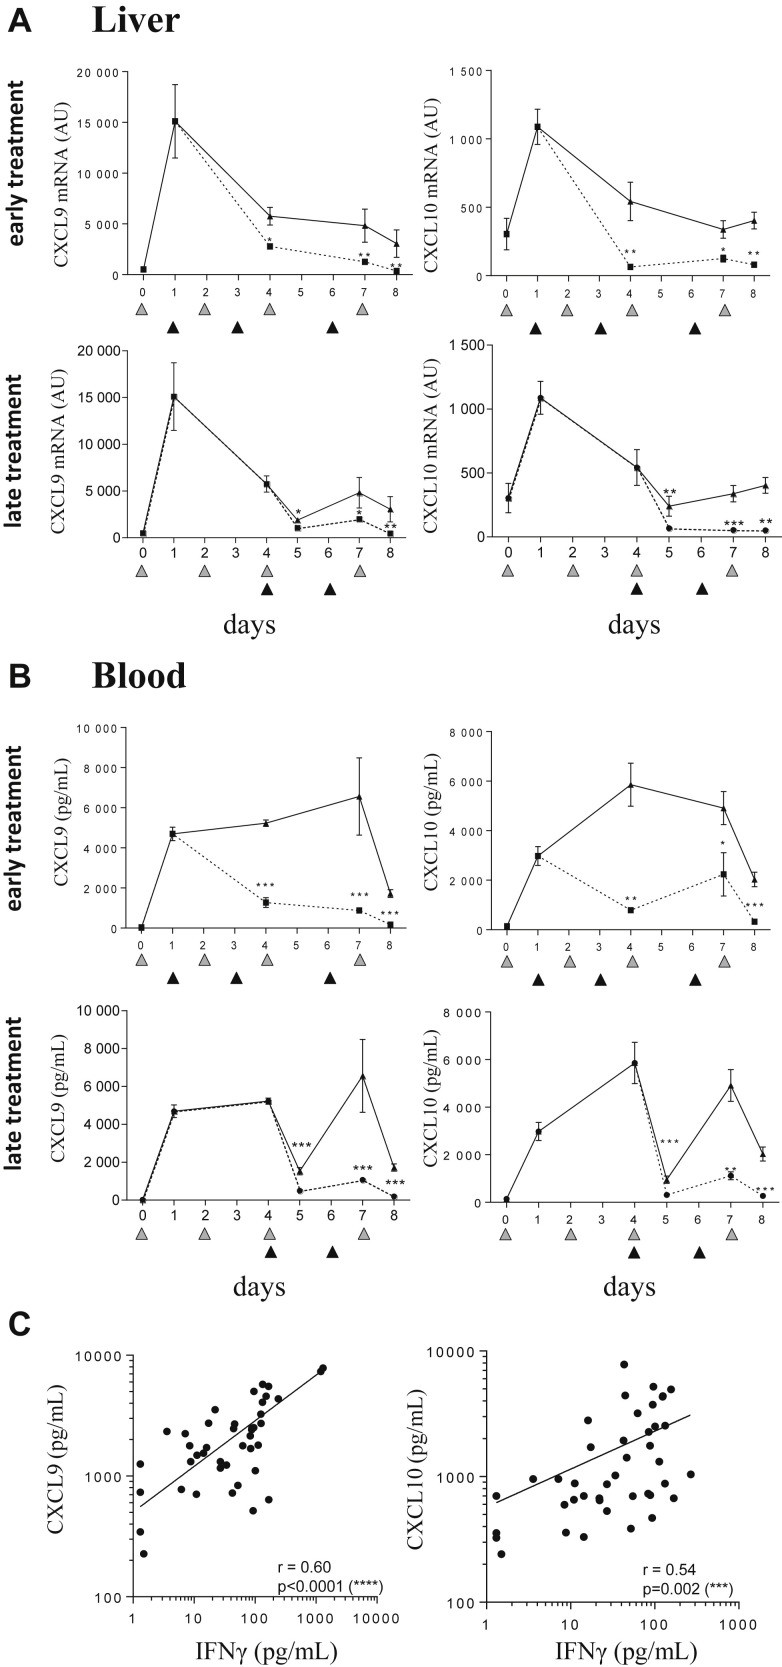
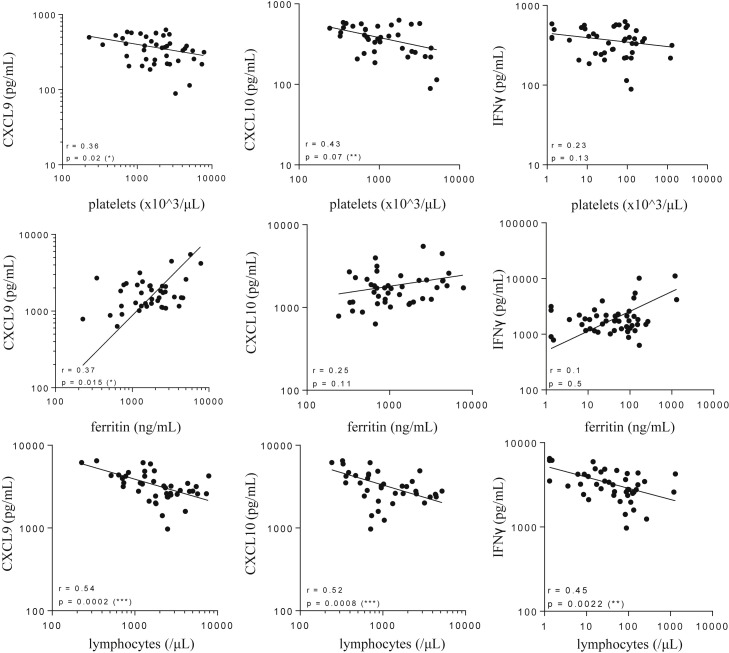
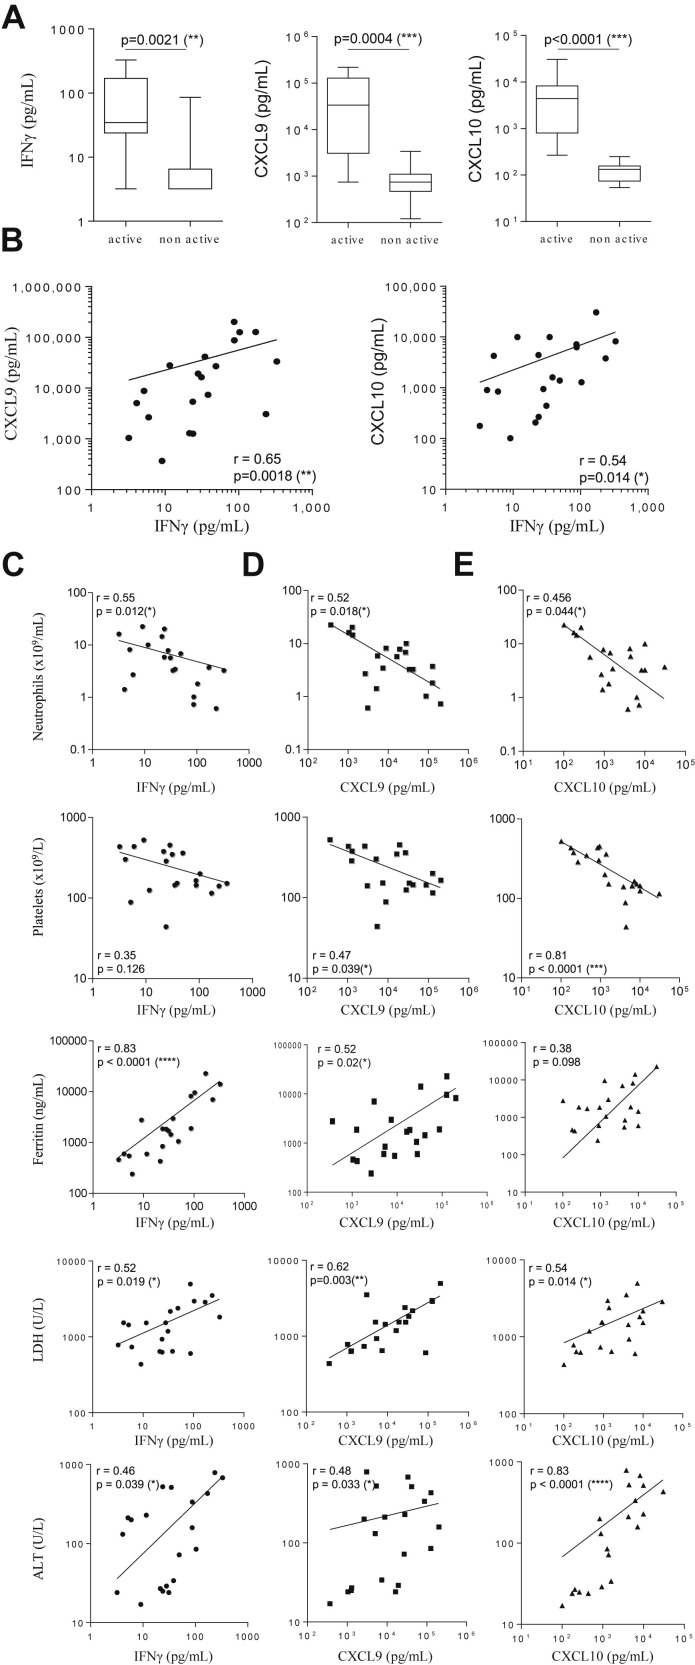
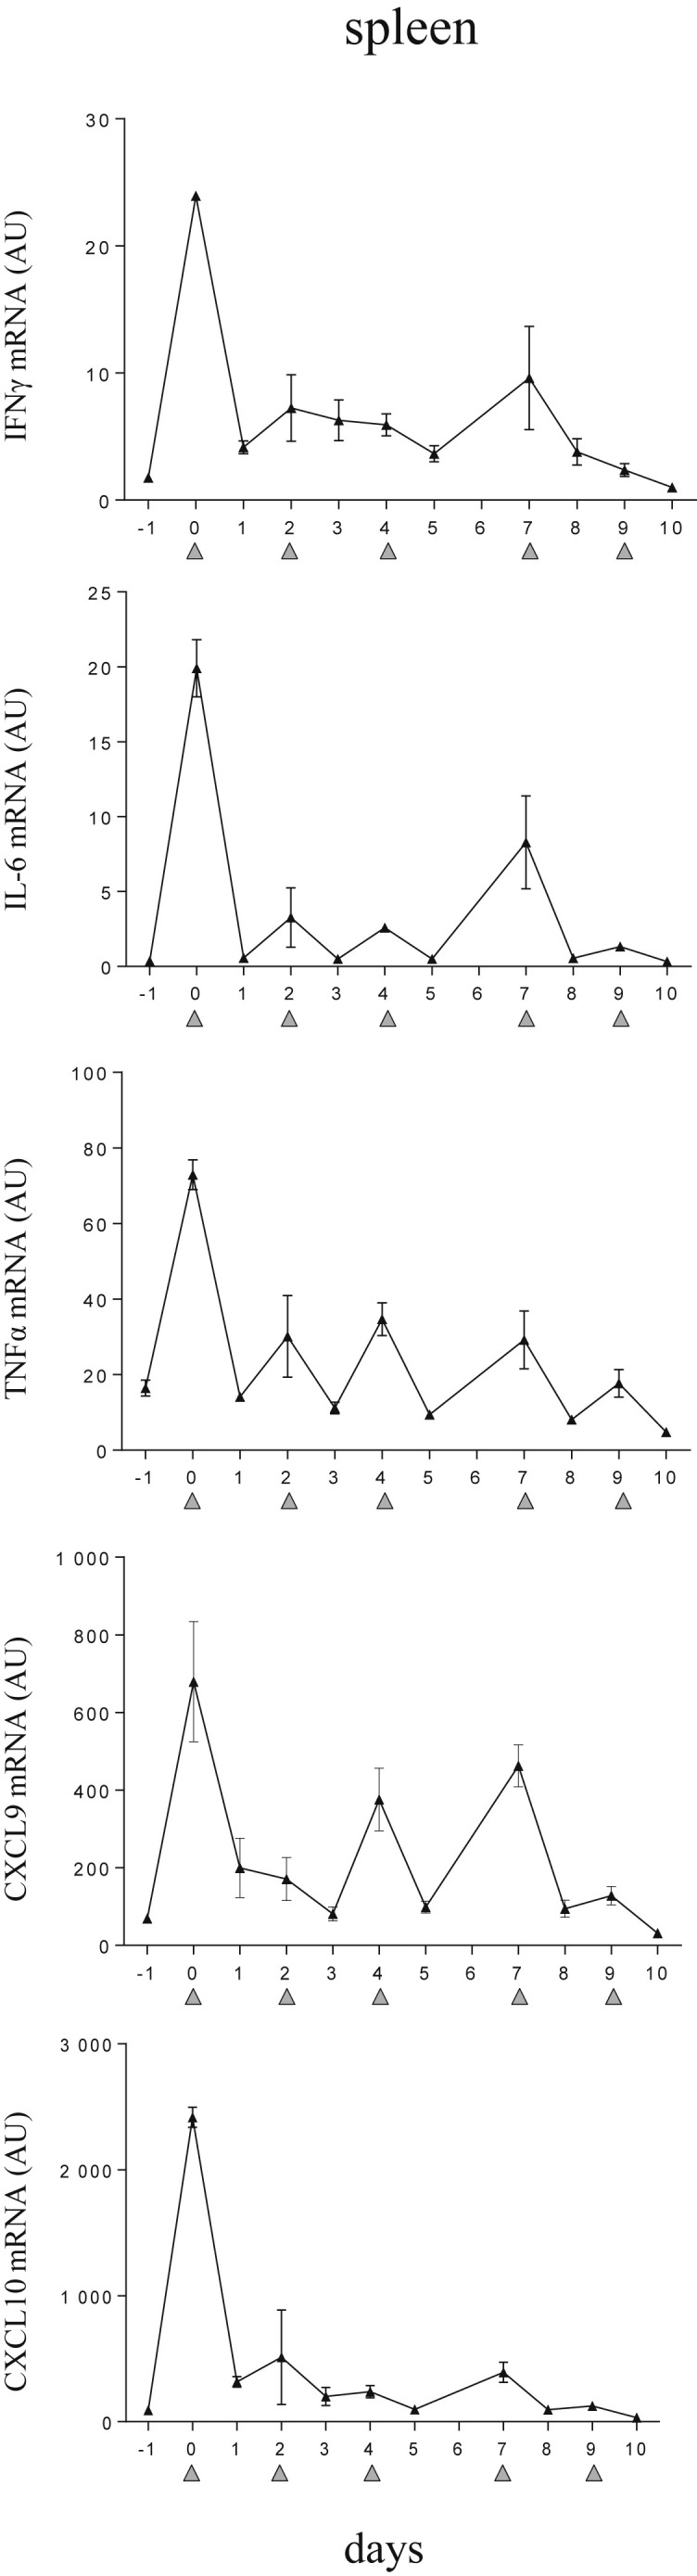
Life-threatening cytokine release syndromes include primary (p) and secondary (s) forms of hemophagocytic lymphohistiocytosis (HLH). Below detection in healthy individuals, interferon γ (IFNγ) levels are elevated to measurable concentrations in these afflictions suggesting a central role for this cytokine in the development and maintenance of HLH. Mimicking an infection-driven model of sHLH in mice, we observed that the tissue-derived levels of IFNγ are actually 500- to 2000-fold higher than those measured in the blood. To identify a blood biomarker, we postulated that the IFNγ gene products, CXCL9 and CXCL10 would correlate with disease parameters in the mouse model. To translate this into a disease relevant biomarker, we investigated whether CXCL9 and CXCL10 levels correlated with disease activity in pediatric sHLH patients. Our data demonstrate that disease control in mice correlates with neutralization of IFNγ activity in tissues and that the 2 chemokines serve as serum biomarkers to reflect disease status. Importantly, CXCL9 and CXCL10 levels in pediatric sHLH were shown to correlate with key disease parameters and severity in these patients. Thus, the translatability of the IFNγ-biomarker correlates from mouse to human, advocating the use of serum CXCL9 or CXCL10 as a means to monitor total IFNγ activity in patients with sHLH.


Figures

Fig 1
Fig 1
CpG-ODN–injected mice display a striking elevation of inflammatory mediators in serum and tissue. Mice (n = 4–5 per time point) were injected with 50 μg of CpG-ODN at days 0, 2, 4, 7, and 9 (gray filled triangles). (A) Serum levels of IFNγ, IL-6, TNFα, CXCL9, and CXCL10 were measured in a multiplex assay using the Luminex technology. (B) Quantification of liver derived mRNA was obtained by qPCR. On days when CpG-ODN was administered, samples were collected 6 hours after injection. Values are the mean ± standard error of the mean. Data are representative of 2 experiments. AU, arbitrary unit; IFNγ, interferon γ; IL-6, interleukin 6; TNFα, tumor necrosis factor α; mRNA, messenger RNA; qPCR, quantitative PCR.
Fig 2
Fig 2
CpG-ODN–injected mice present clinical and laboratory features of sHLH. Mice (n = 4–5 per time point) were injected with 50 μg of CpG-ODN at days 0, 2, 4, 7, and 9 (gray filled triangles). Body and spleen weights were monitored, and blood parameters including lymphocyte, platelet, and red blood cell counts were measured using a hemavet analyzer. Ferritin serum concentrations were measured by ELISA. On days when CpG-ODN was administered, samples were collected 6 hours after injection. Values are the mean ± standard error of the mean. Data are representative of 2 experiments. Statistics were performed between the indicated time point and the baseline (ie, at day −1) values. P < 0.05, ∗∗P < 0.01, and ∗∗∗P < 0.001 were obtained using the 1-tailed nonparametric Mann–Whitney U t test. sHLH, secondary hemophagocytic lymphohistiocytosis.
Fig 3
Fig 3
Neutralization of total IFNγ production in CpG-ODN–injected mice controls the cytokine storm. (A) Mice (n = 8 per time point) were injected with 100 mg/kg of the anti-mIFNγ mAb, XMG1.2, at days −1, 1, 3, and 6 (black filled triangles) and 50 μg of CpG-ODN at days 0, 2, 4, 7, and 9 (gray filled triangles). Serum was obtained predose, at day 10 and 1 hour before each CpG-ODN injection. Total IFNγ was measured using an ELISA assay. Values are the mean ± standard error of the mean (SEM). Data are representative of 2 experiments. (B–E) Mice (n = 8 per time point) were injected with 50 μg of CpG-ODN at days 0, 2, 4, and 7 (gray filled triangles) and administered 100 mg/kg of the anti-mIFNγ mAb, XMG1.2 (dotted line), or an isotype control mAb (solid line), on days 1, 3, and 6 (black filled triangles). Livers were obtained to evaluate CIITA pIV mRNA, an IFNγ-inducible gene, by qPCR (B) IL-6 and TNFα serum concentrations were quantified in a multiplex assay using the Luminex technology (C). Quantification of tissue-derived cytokine mRNA was evaluated by qPCR from the liver (D) and the spleen (E). The samples from day 0 were collected before the CpG-ODN injection, whereas samples from day 4 and day 7 were collected 6 hours after CpG-ODN injection. Samples from the day of a mAb administration were collected before the injection. Values are the mean ± SEM. Data are representative of 2 experiments. Statistics were performed to compare the values at each time point between isotype control and XMG1.2 treated groups. P < 0.05, ∗∗P < 0.01, and ∗∗∗P < 0.001 were obtained using the 1-tailed nonparametric Mann–Whitney U t test. IFNγ, interferon γ; IL-6, interleukin 6; TNFα, tumor necrosis factor α; mRNA, messenger RNA; qPCR, quantitative PCR.
Fig 4
Fig 4
IFNγ is required for hematological and tissue parameters in the model of sHLH. Mice (n = 8 per time point) were injected with 50 μg of CpG-ODN at days 0, 2, 4, and 7 (gray filled triangles) and administered 100 mg/kg of the anti-IFNγ mAb, XMG1.2 (dotted line), or with an isotype control mAb (solid line), on days 1, 3, and 6 (black filled triangles). (A) Body and spleen weights were monitored, and blood parameters, including lymphocyte, platelet, and red blood cell counts, were measured using a hemavet analyzer. Serum ferritin was measured by ELISA. The samples from day 0 were collected before the CpG-ODN injection, whereas samples from day 2, 4, and 7 were collected 6 hours after CpG-ODN injection. Samples from the day of a mAb administration were collected before the injection. Values are the mean ± standard error of the mean. Data are representative of 2 experiments. Statistics were performed at each time point between isotype control and XMG1.2-treated group values. (B) Liver inflammation was evaluated on day 8 by calculating the area that contained foci of leukocyte infiltration as illustrated by the outlined areas in the representative photomicrographs of H and E-stained sections (Zeiss Axiovert 40 CFL; Zeiss AxioCam MRc Rev.3; original magnification ×100) from an isotype control or XMG1.2-treated mouse. The graph represents the quantitative analysis of at least 9 fields per liver capturing the fold increase of area as compared to untreated mice (ie, no CpG injection); each symbol represents an individual mouse; horizontal lines represent the mean values. P < 0.05, ∗∗P < 0.01, and ∗∗∗P < 0.001 were obtained using the 1-tailed nonparametric Mann–Whitney U t test. IFNγ, interferon γ; sHLH, secondary hemophagocytic lymphohistiocytosis.
Fig 5
Fig 5
Late intervention in the sHLH continues to afford clinical benefit. Mice (n = 8 per time point) were injected with 50 μg of CpG-ODN at days 0, 2, 4, and 7 (gray filled triangles) and administered 100 mg/kg of the anti-IFNγ mAb, XMG1.2 (dotted line), or an isotype control mAb (solid line), on days 4 and 6 (black filled triangles). (A) IL-6 and TNFα serum concentrations were quantified in a multiplex assay using the Luminex technology; body and spleen weights were monitored and blood parameters including lymphocyte, platelet and red blood cell counts were measured using a hemavet analyzer and serum ferritin was measured by ELISA. (B) Liver inflammation was evaluated on day 8 by calculating the area that contained foci of leukocyte infiltration as illustrated in (B). The graph represents the quantitative analysis of at least 9 fields per liver capturing the fold increase of area as compared to untreated mice (ie, no CpG injection); each symbol represents an individual mouse; horizontal lines represent the mean values. IL-6 and TNFα mRNA levels were evaluated by qPCR in the liver. The samples from day 0 were collected before the CpG-ODN injection, whereas samples from day 4 and day 7 were collected 6 hours after CpG-ODN injection. Samples from the day of a mAb administration were collected before the injection. Values are the mean ± standard error of the mean. Data are representative of 1 experiment. Statistics were performed at each time point between isotype control and XMG1.2-treated groups. P < 0.05, ∗∗P < 0.01, and ∗∗∗P < 0.001 were obtained using the 1-tailed nonparametric Mann–Whitney U t test. AU, arbitrary unit; IL-6, interleukin 6; TNFα, tumor necrosis factor α; mRNA, messenger RNA; qPCR, quantitative PCR; sHLH, secondary hemophagocytic lymphohistiocytosis.
Fig 6
Fig 6
Circulating CXCL9 and CXCL10 production correlate with IFNγ tissue activity in the model of TLR9-induced sHLH. (A, B) Mice (n = 7 mice per time-point) were injected with 50 μg of CpG-ODN on days 0, 2, 4, and 7 (gray filled triangles) and administered 100 mg/kg of the anti-IFNγ mAb, XMG1.2 (dotted line) or an isotype control mAb (solid line) at days 1, 3, and 6 (A and B, upper panels; black filled triangles) or at days 4 and 6 (A and B, lower panels; black filled triangles). mRNA quantification of cytokines from livers was obtained by qPCR, and serum concentrations of CXCL9 and CXCL10 were quantified in a multiplex assay using the Luminex technology. The samples from day 0 were collected before the CpG-ODN injection, whereas samples from day 4 and day 7 were collected 6 hours after CpG-ODN injection. Samples from the day of a mAb injection were collected before the injection. Values are the mean ± standard error of the mean. Data are representative of 2 experiments. Statistics were performed to compare the values at each time point between isotype control and XMG1.2-treated groups. P < 0.05, ∗∗P < 0.01, ∗∗∗P < 0.001, and ****P < 0.0001 were obtained using the 1-tailed nonparametric Mann–Whitney U t test. (C) Mice were injected with 50 μg of CpG-ODN at days 0, 2, 4, 7, and 9. Serum levels of IFNγ, CXCL9, and CXCL10 were quantified in a multiplex assay using the Luminex technology. Correlations were performed between CXCL9 and IFNγ or CXCL10 and IFNγ levels at different time point as HLH develops (depicted in Fig 1). Statistics were performed and P values were obtained using the Spearman test. The line of best fit was generated using the nonlinear regression analysis using GrapPad Prism software. IFNγ, interferon γ; mRNA, messenger RNA; qPCR, quantitative PCR; sHLH, secondary hemophagocytic lymphohistiocytosis; TLR9, Toll-like receptor 9.
Fig 7
Fig 7
Circulating CXCL9 and CXCL10 levels correlate with disease parameters in the model of TLR9-induced sHLH. Mice were injected with 50 μg of CpG-ODN at days 0, 2, 4, 7, and 9. Serum levels of CXCL9, CXCL10, and IFNγ were quantified in a multiplex assay using the Luminex technology. Blood parameters including platelet and lymphocyte counts were measured using a hemavet analyzer, and serum ferritin was measured by ELISA. Correlations were performed between CXCL9 and disease parameters, CXCL10 and disease parameters, and IFNγ and disease parameters at different time point as HLH develops (depicted in Fig 1). Statistics were performed and P values were obtained using the Spearman test. *P < 0.05, **P < 0.01, and ***P < 0.001. The line of best fit was generated using the nonlinear regression analysis using GrapPad Prism software. TLR9, Toll-like receptor 9; sHLH, secondary hemophagocytic lymphohistiocytosis; IFNγ, interferon γ.
Fig 8
Fig 8
CXCL9 and CXCL10 production correlate with IFNγ activity in patients with sHLH. (A) Serum levels of IFNγ, CXCL9, and CXCL10 in patients with sHLH sampled during full-blown active or nonactive disease were quantified in a multiplex assay using the Luminex technology. Statistics were performed and P values were obtained using the Mann–Whitney U test. (B) Correlations were performed for IFNγ with CXCL9 or CXCL10 levels in sera of patients with active full-blown sHLH. Statistics were performed and P values were obtained using the Spearman test. (C–E). Correlations were performed between serum IFNγ (C), CXCL9 (D), or CXCL10 (E) levels with neutrophil count, platelet count, ferritin, LDH or ALT concentrations. Statistics were performed and P values obtained using the Spearman test. *P < 0.05, **P < 0.01, ***P < 0.001, and ****P < 0.0001. The line of best fit was generated using the nonlinear regression analysis using GrapPad Prism software. IFNγ, interferon γ; sHLH, secondary hemophagocytic lymphohistiocytosis; ALT, alanine transaminase; LDH, lactate dehydrogenase.
Supplementary Fig 1
Supplementary Fig 1
CpG-ODN–injected mice display a striking elevation of inflammatory mediators in spleen. Mice were injected with 50 μg of CpG-ODN at days 0, 2, 4, 7, and 9 (gray filled triangles). Quantification of splenic derived mRNA was obtained by qPCR. On days when CpG-ODN was administered, tissue samples were collected 6 hours after injection. Values are the mean ± standard error of the mean. Data are representative of 2 experiments. AU, arbitrary unit; mRNA, messenger RNA; qPCR, quantitative PCR; IFNγ, interferon γ; IL-6, interleukin 6; tumor necrosis factor α.

References

    1. Tisoncik J.R., Korth M.J., Simmons C.P. Into the eye of the cytokine storm. Microbiol Mol Biol Rev. 2012;76:16–32. - PMC - PubMed
    1. Ferrara J.L., Abhyankar S., Gilliland D.G. Cytokine storm of graft-versus-host disease: a critical effector role for interleukin-1. Transplant Proc. 1993;25:1216–1217. - PubMed
    1. Yokota S. Influenza-associated encephalopathy–pathophysiology and disease mechanismsNihon Rinsho. 2003;61:1953–1958. - PubMed
    1. Wauquier N., Becquart P., Padilla C., Baize S., Leroy E.M. Human fatal zaire ebola virus infection is associated with an aberrant innate immunity and with massive lymphocyte apoptosis. PLoS Negl Trop Dis. 2010;4:e837. - PMC - PubMed
    1. Clark I.A., Cowden W.B. The pathophysiology of falciparum malaria. Pharmacol Ther. 2003;99:221–260. - PubMed

Publication types