. 2016 Aug 25;11(8):e0159921.
doi: 10.1371/journal.pone.0159921. eCollection 2016.

BEclear: Batch Effect Detection and Adjustment in DNA Methylation Data

Affiliations

BEclear: Batch Effect Detection and Adjustment in DNA Methylation Data

Ruslan Akulenko et al. PLoS One. .

Abstract

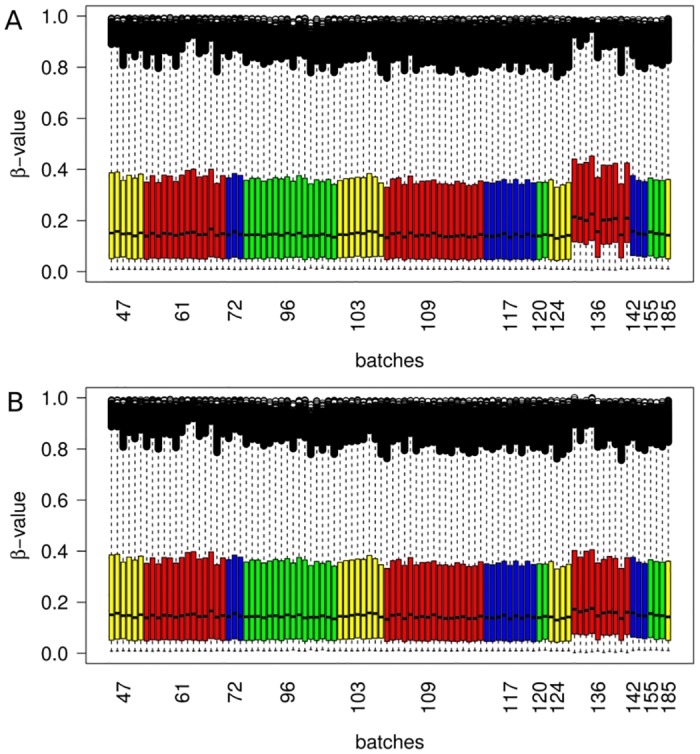
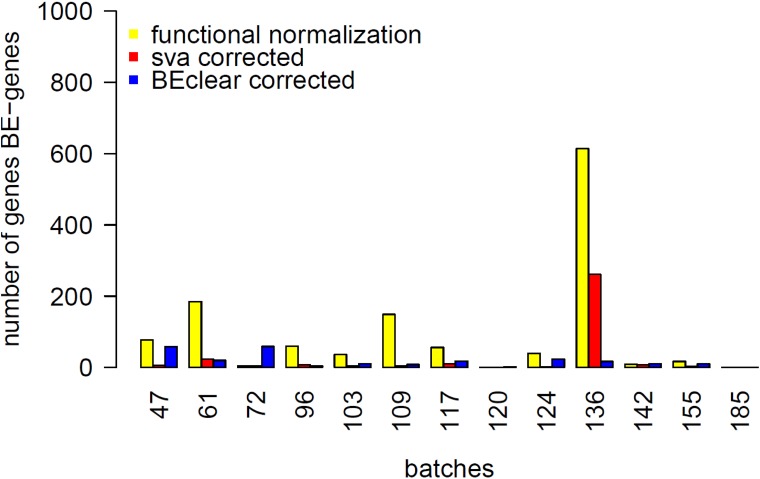
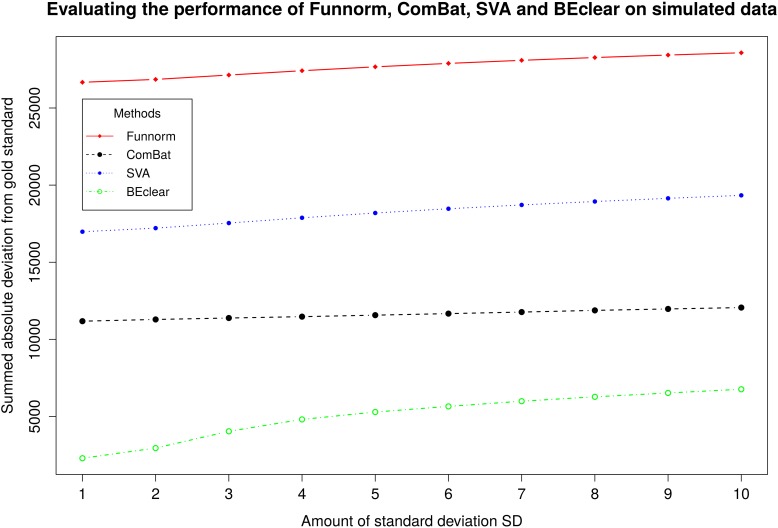
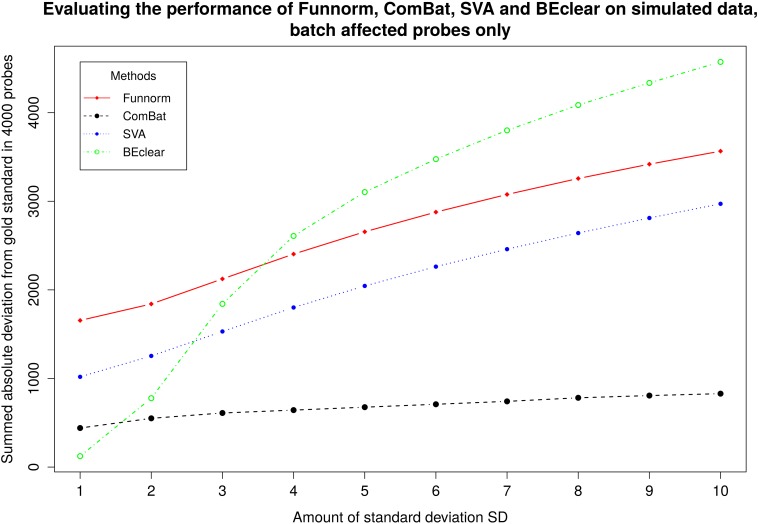
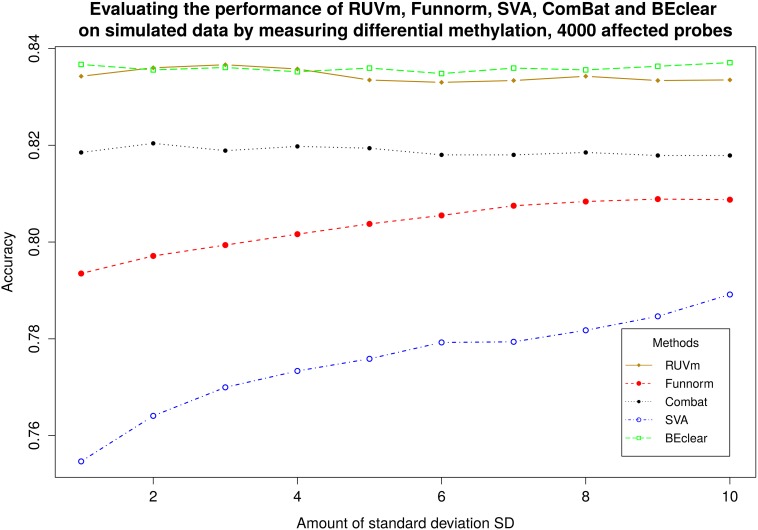
Batch effects describe non-natural variations of, for example, large-scale genomic data sets. If not corrected by suitable numerical algorithms, batch effects may seriously affect the analysis of these datasets. The novel array platform independent software tool BEclear enables researchers to identify those portions of the data that deviate statistically significant from the remaining data and to replace these portions by typical values reconstructed from neighboring data entries based on latent factor models. In contrast to other comparable methods that often use some sort of global normalization of the data, BEclear avoids changing the apparently unaffected parts of the data. We tested the performance of this approach on DNA methylation data for various tumor data sets taken from The Cancer Genome Atlas and compared the results to those obtained with the existing algorithms ComBat, Surrogate Variable Analysis, RUVm and Functional normalization. BEclear constantly performed at par with or better than these methods. BEclear is available as an R package at the Bioconductor project http://bioconductor.org/packages/release/bioc/html/BEclear.html.


Conflict of interest statement

The authors have declared that no competing interests exist.

Figures

Fig 1
Fig 1. Box plots of adjacent normal breast cancer samples from TCGA (level 3 data—calculated β-values mapped to the genome), per sample level (96 samples).
A. before batch effect adjustment. The p-value < 0.001 for BE-score of batch 136 (Dixon test) B. after applying BEclear method.
Fig 2
Fig 2. Comparison of BEclear, SVA and Functional normalization (minfi package) with respect to the number of BE-genes still remaining after the correction of adjacent normal BRCA data.
Batch affected genes are defined as genes with (1) median difference above 5% of β-value distribution and (2) showing a statistically significant difference in this batch compared to all other batches with (p-value ≤ 0.01) according to the Kolmogorov-Smirnov test.
Fig 3
Fig 3. Comparison of BEclear, SVA, ComBat and Functional normalization using simulated batch effect.
On the x-axis, we quantify the magnitude of the introduced batch effect perturbation in terms of multiples of the standard deviation of the data. As a measure of performance, the y-axis shows the total absolute difference of level 1 β-value between gold standard data and corrected entries for 8000 probes in 13 batches.
Fig 4
Fig 4. Comparison of BEclear, SVA, ComBat, and Functional normalization using simulated batch effect (compare Fig 3).
As a measure of performance we used the total absolute difference between gold standard data and corrected entries for 4000 batch affected probes in batch 136.
Fig 5
Fig 5. Comparison of RUVm, BEclear, SVA, ComBat, and Functional normalization using simulated batch effect.
For all methods the list of differentially methylated genes (DMG) was obtained and then compared to the list of DMG for gold standard data. Here batch affect was introduced to 4000 probes.

References

    1. Parker HS, Leek JT. The practical effect of batch on genomic prediction. Stat Appl Genet Mol Biol.2012;11: Article-10. - PMC - PubMed
    1. Akulenko R, Helms V. DNA co-methylation analysis suggests novel functional associations between gene pairs in breast cancer samples. Hum Mol Genet. 2013;22:3016–3022. 10.1093/hmg/ddt158 - DOI - PubMed
    1. Bushel P. pvca: Principal Variance Component Analysis (PVCA). 2013. R package version 1.6.0. Available: https://www.bioconductor.org/packages/release/bioc/html/pvca.html.
    1. Johnson WE, Cheng L. Adjusting batch effects in microarray expression data using empirical Bayes methods. Biostatistics. 2007;8: 118–127. - PubMed
    1. Fortin JP, Labbe A, Lemire M, Zanke BW, Hudson TJ, Fertig EJ, et al. Functional normalization of 450k methylation array data improves replication in large cancer studies. Genome Biology. 2014;15:503 10.1186/s13059-014-0503-2 - DOI - PMC - PubMed