. 2017 Jan;56(1):38-49.
doi: 10.1165/rcmb.2016-0198OC.

Shelterin Telomere Protection Protein 1 Reduction Causes Telomere Attrition and Cellular Senescence via Sirtuin 1 Deacetylase in Chronic Obstructive Pulmonary Disease

Affiliations

Shelterin Telomere Protection Protein 1 Reduction Causes Telomere Attrition and Cellular Senescence via Sirtuin 1 Deacetylase in Chronic Obstructive Pulmonary Disease

Tanveer Ahmad et al. Am J Respir Cell Mol Biol. 2017 Jan.

Abstract

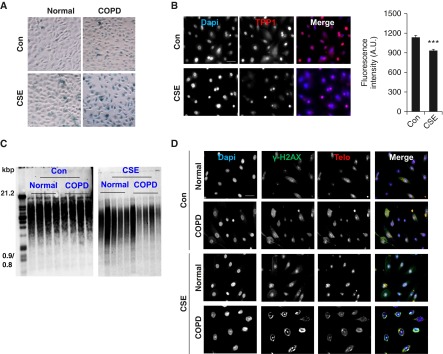
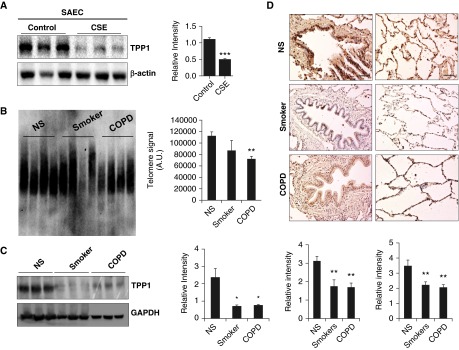
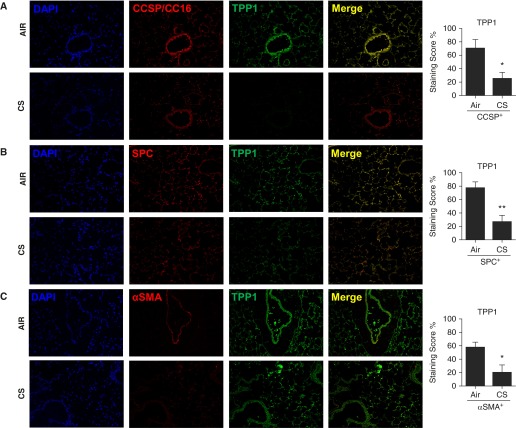
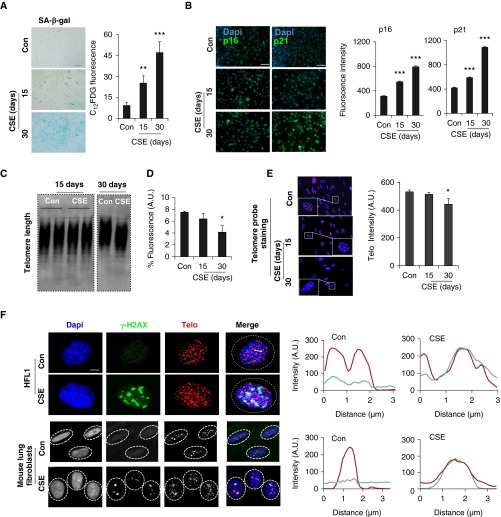
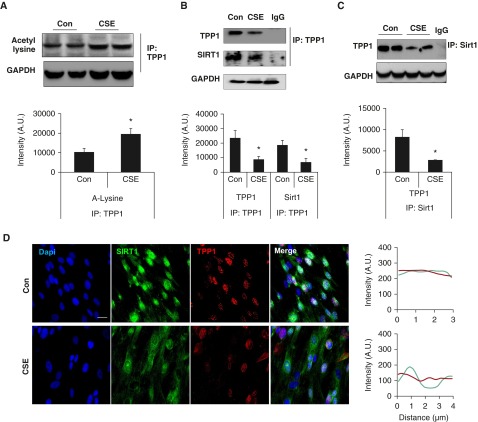
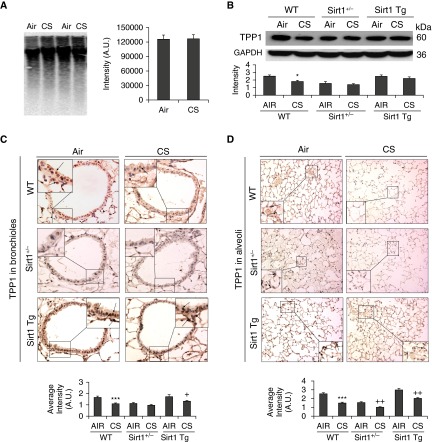
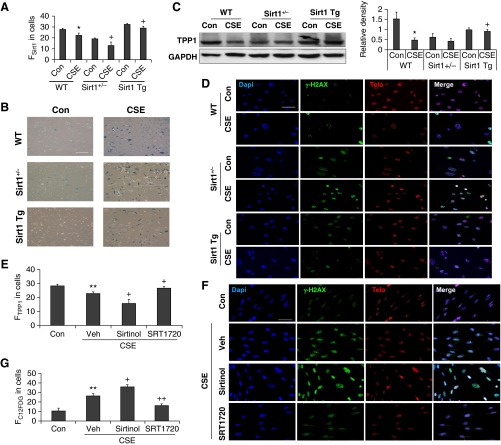
Lung cellular senescence and inflammatory response are the key events in the pathogenesis of chronic obstructive pulmonary disease (COPD) when cigarette smoke (CS) is the main etiological factor. Telomere dysfunction is induced by either critical shortening or disruption of the shelterin complex, leading to cellular senescence. However, it remains unknown whether disruption of the shelterin complex is responsible for CS-induced lung cellular senescence. Here we show that telomere protection protein 1 (TPP1) levels are reduced on telomeres in lungs from mice with emphysema, as well as in lungs from smokers and from patients with COPD. This is associated with persistent telomeric DNA damage, leading to cellular senescence. CS disrupts the interaction of TPP1 with the Sirtuin 1 (Sirt1) complex, leading to increased TPP1 acetylation and degradation. Lung fibroblasts deficient in Sirt1 or treated with a selective Sirt1 inhibitor exhibit increased cellular senescence and decreased TPP1 levels, whereas Sirt1 overexpression and pharmacological activation protect against CS-induced TPP1 reduction and telomeric DNA damage. Our findings support an essential role of TPP1 in protecting CS-induced telomeric DNA damage and cellular senescence, and therefore provide a rationale for a potential therapy for COPD, on the basis of the shelterin complex, in attenuating cellular senescence.

Keywords: Sirtuin1; cellular senescence; emphysema; shelterin complex; telomeric DNA damage.


Figures

Figure 1.
Figure 1.
Small airway epithelial cells (SAECs) from patients with chronic obstructive pulmonary disease (COPD) show increased senescence and telomere dysfunction, together with telomere protection protein 1 (TPP1) reduction, which is augmented by cigarette smoke extract (CSE) treatment. SAECs from normal subjects and from patients with COPD were treated with CSE (0.2%) for 10 days. (A) Representative images showing senescence-associated β-galactosidase activity in human SAECs. (B) Representative images of cells stained with TPP1 (red) and Dapi (4′6-diamidino-2-phenylindole, blue), showing TPP1 expression in SAECs from normal subjects. Scale bar: 100 μm. The average fluorescent intensity of TPP1 was calculated in SAECs treated with CSE using MetaMorph software. (C) Southern blot–based telomere length assay was performed in SAECs treated with CSE. (D) Representative images of CSE-treated SAECs from normal subjects and from patients with COPD were stained with γH2AX (green) and teloprobe (Telo, red), together with Dapi (blue) for telomere dysfunction–induced foci. Scale bar: 100 µm. Data are shown as mean ± SEM (n = 3–5). ***P< 0.001 versus control (Con). A.U., arbitrary units. Con, untreated control.
Figure 2.
Figure 2.
TPP1 reduction is observed in primary airway epithelial cells, mouse lung cells, and lungs of patients with COPD. (A) SAECs showing reduced TPP1 levels after being treated with CSE (0.2%) for 15 days. Densitometry of the corresponding bands was normalized to β-actin loading control. (B) Southern blot–based telomere length assay was performed in lungs from nonsmokers (NS), smokers, and patients with COPD. Densitometry of bands for telomere length is presented. (C) Western blot of TPP1 in lung homogenates from NS, smokers, and patients with COPD was performed, and representative glyceraldehyde phosphate dehydrogenase (GAPDH) was used as a loading control. Densitometry of the corresponding bands was normalized to GADPH. (D) Representative images of bronchial staining of TPP1 in lungs from NS, smokers, and patients with COPD are presented; histogram shows the average intensity of TPP1 staining using MetaMorph software. Representative images of the alveolar region of TPP1 staining in lungs from NS, smokers, and patients with COPD are presented. Average intensity of TPP1 staining was calculated using MetaMorph software. Scale bars: 100 μm. Data are shown as mean ± SEM (n = 3–4). *P< 0.05, **P < 0.01 versus NS; ***P < 0.001 versus control.
Figure 3.
Figure 3.
TPP1 reduction in airway epithelium, alveolar type II cells, and lung fibroblasts by chronic cigarette smoke (CS) exposure in emphysematous mice. (A) TPP1 expression in CCSP+ (Club/Clara Cell Secretory Protein, CC16 in the small airways [CC16/CC10]) cells, (B) proSPC+ (pro-surfactant protein C) alveolar type II cells, and (C) α smooth muscle actin (αSMA)+ lung fibroblasts was reduced by chronic CS exposure in mice. Immunofluorescence staining scores for TPP1 expression in CCSP+ CC10 airway, SPC+ alveolar epithelial cells, and αSMA+ lung fibroblasts were determined semiquantitatively in a blinded fashion and are presented as staining score percentage (%). Data are shown as mean ± SEM (n = 3–4/group). *P < 0.05, **P < 0.01 versus air group.
Figure 4.
Figure 4.
CSE-induced cellular senescence and telomere dysfunction–induced foci (TIF) formation in lung fibroblasts. (A) Human lung fibroblast (HFL1) cells were treated with CSE (0.5%) for 15 days and 30 days, and senescence-associated β-galactosidase (SA-β-gal) staining was performed for cellular senescence. Scale bar: 100 µm. Degree of cellular senescence measured by C12FDG fluorescence using FACS was shown as fluorescent intensity. (B) Immunofluorescence was performed in HFL1 cells treated with CSE (0.5%) for 15 days and 30 days to determine the expression of p16 and p21. Scale bars: 100 µm. Fluorescence intensity for p16 and p21 expression was measured quantitatively in HFL1 cells using MetaMorph software. (C) Telomere length assay was performed on the basis of the Southern blot–based technique in HFL1 cells treated with CSE (0.25%) for 15 days and 30 days. (D) Telomere length measurement by FACS, which is shown as % intensity of the telomere fluorescence. (E) Representative images of HFL1 cells showing telomere staining. Cells treated with CSE were stained with Telo (red) and Dapi (blue). Quantitative measurement of telomere length by fluorescence intensity in HFL1 cells treated with CSE at indicated time points. Insets showing magnified telomere staining. (F) Representative images of TIFs in CSE-treated HFL1 cells (0.5%) and mouse lung fibroblasts (0.25%) for 15 days. Cells were stained with γ-H2AX (blue) and Telo (red), together with Dapi (blue). Scale bar: 100 µm. Line scan data of corresponding images show the degree of colocalization between Telo (red) and γ-H2AX (green). Data are shown as mean ± SEM (n = 3–4). *P< 0.05, **P< 0.01, ***P< 0.001 versus control. FACS, fluorescence-activated cell sorting; C12FDG, 5-dodecanoylaminofluorescein di-β-d-galactopyranoside.
Figure 5.
Figure 5.
CSE causes TPP1 acetylation and disrupts its interaction with Sirtuin 1 (Sirt1) in HFL1 cells. HFL1 cells were treated with CSE (0.5%) for (A) 24 hours or (BD) 15 days. (A) Cell lysates were immunoprecipitated by TPP1 antibody, followed by probing with anti–acetyl lysine antibody. (B) Immunoprecipitated TPP1 immunocomplex was used for Western blot, which was probed with Sirt1 and TPP1 antibodies. (C) Western blot images of immunoprecipitation of Sirt1, followed by its probing with TPP1. Representative GAPDH was used as a loading control, which was run separately from the same samples without IP. Densitometry of the corresponding blots is presented. (D) Representative images of TPP1 (green) and Sirt1 (red) showing the colocalization in the nucleus, which was stained with Dapi (blue). Scale bar: 100 µm. Line scan data of corresponding images show the degree of colocalization between TPP1 and Sirt1. Data are shown as mean ± SEM (n = 3–4). *P< 0.05 versus control. IP, immunoprecipitation.
Figure 6.
Figure 6.
TPP1 reduction is observed in mouse lungs with emphysema. Sirt1+/−, Sirt1 Tg, and WT mice were exposed to CS for 6 months. (A) Telomere length assay was performed in mouse lungs on the basis of a Southern blot–based technique. (B) Western blot of TPP1 in lung homogenates was performed, and representative GAPDH was used as a loading control. Densitometry of the corresponding bands was normalized to GADPH. Representative images of TPP1 expression in (C) the bronchial airways (insets showing magnified image of stained bronchial epithelial cells) and (D) the alveolar region in mouse lungs and histogram show the average intensity of TPP1 staining in the bronchial and alveolar regions calculated using MetaMorph software. Arrows indicate dark brown staining for TPP1 expression in bronchial airway and alveolar epithelial cells shown in (C) and (D). Data are shown as mean ± SEM (n = 3–4). *P< 0.05, ***P< 0.001 versus WT-Air; +P < 0.05, ++P< 0.01 versus WT-CS. Sirt1+/−, Sirt1 heterozygous knockout; Sirt1 Tg, Sirt1 transgenic; WT, wild type.
Figure 7.
Figure 7.
Sirt1 regulates CSE-induced TPP1 reduction and TIF formation in lung fibroblasts. (AD) Mouse lung fibroblasts isolated from Sirt1+/−, Sirt1 Tg, and WT mice were treated with CSE (0.25% for 15 d). (A) Sirt1 levels determined by FACS in CSE-treated lung fibroblasts from WT, Sirt1+/−, and Sirt1 Tg mice. (B) Representative images of SA-β-gal staining in mouse lung fibroblasts treated with CSE. Scale bar: 100 µm. (C) Western blot of TPP1 in whole cell extracts of lung fibroblasts obtained from WT, Sirt1+/−, and Sirt1 Tg mice. Representative GAPDH was used as a loading control. Densitometry of the corresponding TPP1 bands normalized to GAPDH. (D) Lung fibroblasts were stained with Dapi (blue), γH2AX (green), and Telo (red) for TIF formation. Scale bar: 100 µm. (EG) HFL1 cells were treated with CSE (0.5%) for 15 days in the presence of SIRT1 inhibitor (sirtinol, 1 μM) or activator (SRT1720, 10 μM). (E) TPP1 levels were determined by the FACS in CSE-treated HFL1 cells in the presence of sirtinol or SRT1720. (F) HFL1 cells were stained with γ-H2AX (green) and Telo (red) for TIF formation, together with Dapi (blue). Scale bar: 100 µm. (G) C12FDG fluorescence in CSE-treated HFL1 cells measured by the FACS was plotted as FC12FDG in cells, which showed that the degree of cellular senescence was arbitrary. Data are shown as mean ± SEM (n = 3–4). *P< 0.05, **P< 0.01 versus Con; +P < 0.05, ++P< 0.01 versus CSE group. FC12FDG, fluorescent intensity of 5-dodecanoylaminofluorescein di-β-d-galactopyranoside; FSirt1, fluorescent intensity of Sirt1; FTPP1, fluorescent intensity of TPP1; Veh, vehicle.

References

    1. Nandakumar J, Bell CF, Weidenfeld I, Zaug AJ, Leinwand LA, Cech TR. The TEL patch of telomere protein TPP1 mediates telomerase recruitment and processivity. Nature. 2012;492:285–289. - PMC - PubMed
    1. Cesare AJ, Kaul Z, Cohen SB, Napier CE, Pickett HA, Neumann AA, Reddel RR. Spontaneous occurrence of telomeric DNA damage response in the absence of chromosome fusions. Nat Struct Mol Biol. 2009;16:1244–1251. - PubMed
    1. de Lange T. Shelterin: the protein complex that shapes and safeguards human telomeres. Genes Dev. 2005;19:2100–2110. - PubMed
    1. Suram A, Herbig U. The replicometer is broken: telomeres activate cellular senescence in response to genotoxic stresses. Aging Cell. 2014;13:780–786. - PMC - PubMed
    1. Wood AM, Laster K, Rice EL, Kosak ST. A beginning of the end: new insights into the functional organization of telomeres. Nucleus. 2015;6:172–178. - PMC - PubMed

MeSH terms