

Cell Painting, a high-content image-based assay for morphological profiling using multiplexed fluorescent dyes
- PMID: 27560178
- PMCID: PMC5223290
- DOI: 10.1038/nprot.2016.105
Cell Painting, a high-content image-based assay for morphological profiling using multiplexed fluorescent dyes
Abstract
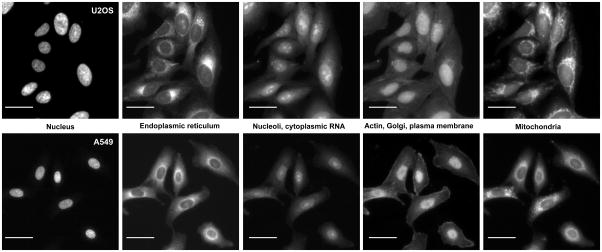
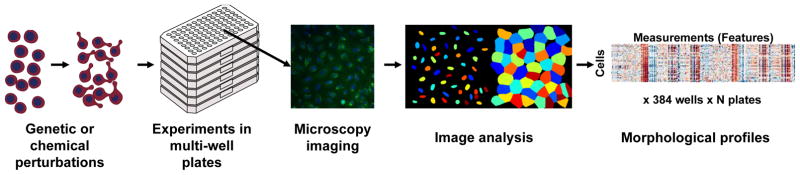
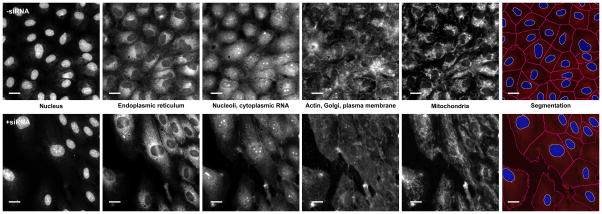
In morphological profiling, quantitative data are extracted from microscopy images of cells to identify biologically relevant similarities and differences among samples based on these profiles. This protocol describes the design and execution of experiments using Cell Painting, which is a morphological profiling assay that multiplexes six fluorescent dyes, imaged in five channels, to reveal eight broadly relevant cellular components or organelles. Cells are plated in multiwell plates, perturbed with the treatments to be tested, stained, fixed, and imaged on a high-throughput microscope. Next, an automated image analysis software identifies individual cells and measures ∼1,500 morphological features (various measures of size, shape, texture, intensity, and so on) to produce a rich profile that is suitable for the detection of subtle phenotypes. Profiles of cell populations treated with different experimental perturbations can be compared to suit many goals, such as identifying the phenotypic impact of chemical or genetic perturbations, grouping compounds and/or genes into functional pathways, and identifying signatures of disease. Cell culture and image acquisition takes 2 weeks; feature extraction and data analysis take an additional 1-2 weeks.
Conflict of interest statement
The authors declare competing financial interests. Recursion Pharmaceuticals is a biotechnology company in which CCG, BB, CTD, HH, and AEC have real or optional ownership interest (see the HTML version of this article for details).
Figures
References
-
- Swinney DC, Anthony J. How were new medicines discovered? Nat Rev Drug Discov. 2011;10:507–519. - PubMed
-
- Swinney DC. The Contribution of Mechanistic Understanding to Phenotypic Screening for First-in-Class Medicines. J Biomol Screen. 2013;18:1186–1192. - PubMed
-
- Moffat JG, Joachim R, David B. Phenotypic screening in cancer drug discovery — past, present and future. Nat Rev Drug Discov. 2014;13:588–602. - PubMed
-
- Bickle M. The beautiful cell: high-content screening in drug discovery. Anal Bioanal Chem. 2010;398:219–226. - PubMed
Publication types
MeSH terms
Substances
Grants and funding
LinkOut - more resources
Full Text Sources
Other Literature Sources
