. 2016 Aug 25;7(8):e2347.
doi: 10.1038/cddis.2016.243.

Fucosylation of LAMP-1 and LAMP-2 by FUT1 correlates with lysosomal positioning and autophagic flux of breast cancer cells

Affiliations

Fucosylation of LAMP-1 and LAMP-2 by FUT1 correlates with lysosomal positioning and autophagic flux of breast cancer cells

Keng-Poo Tan et al. Cell Death Dis. .

Abstract

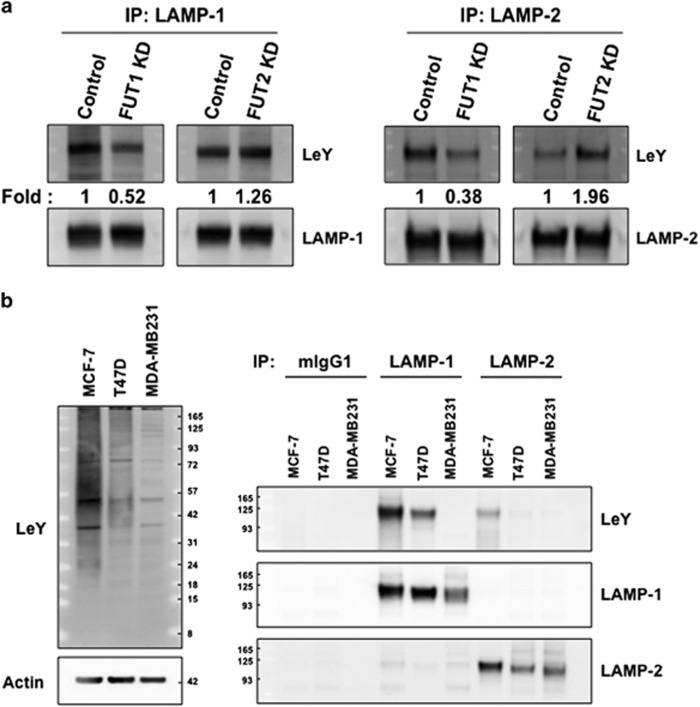
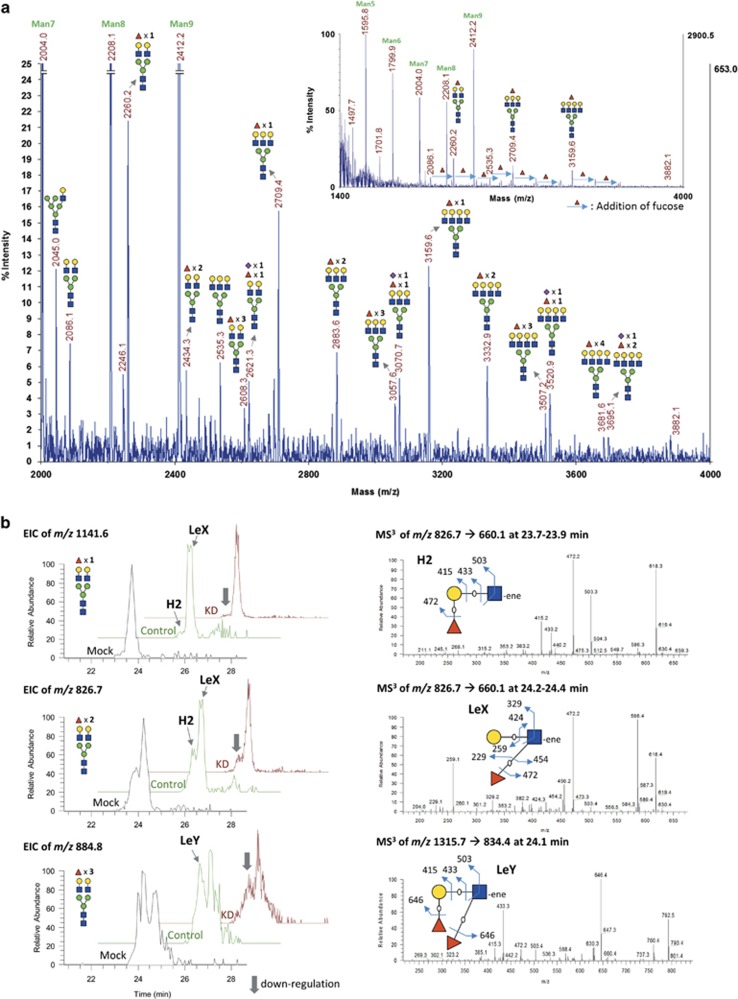
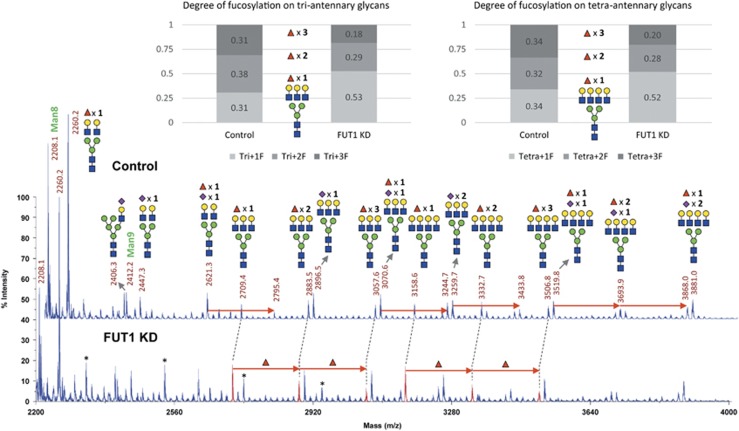
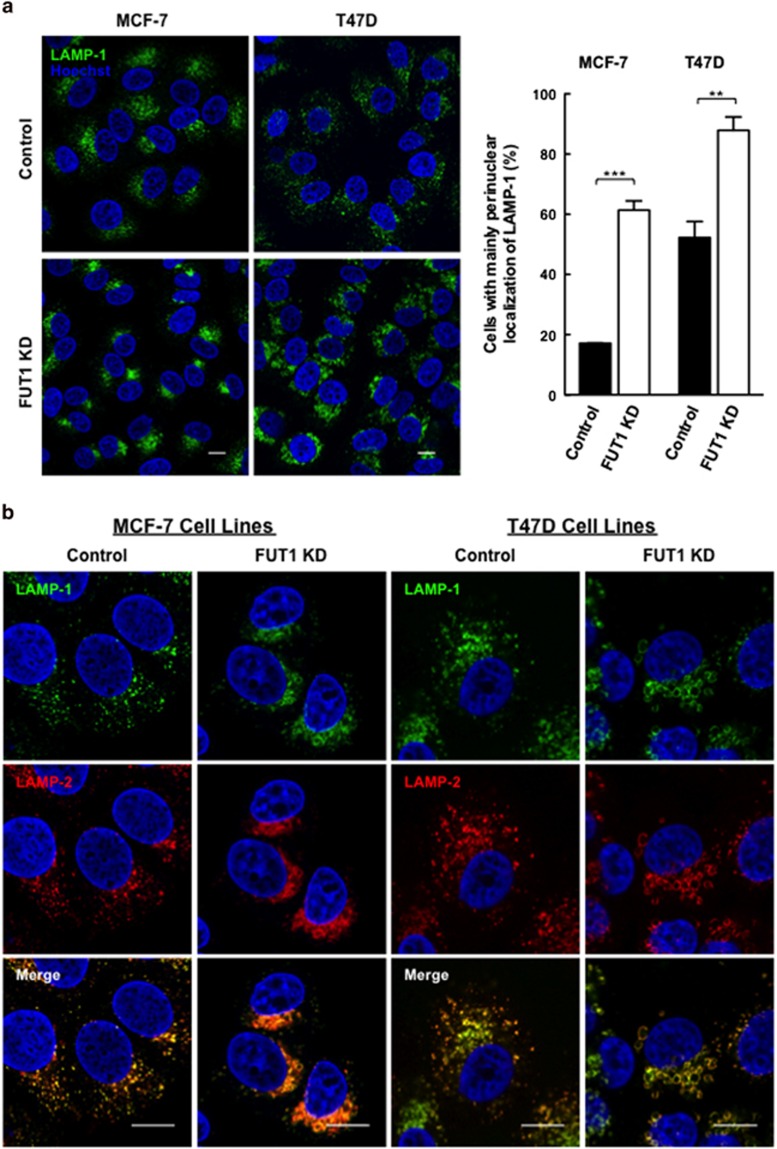
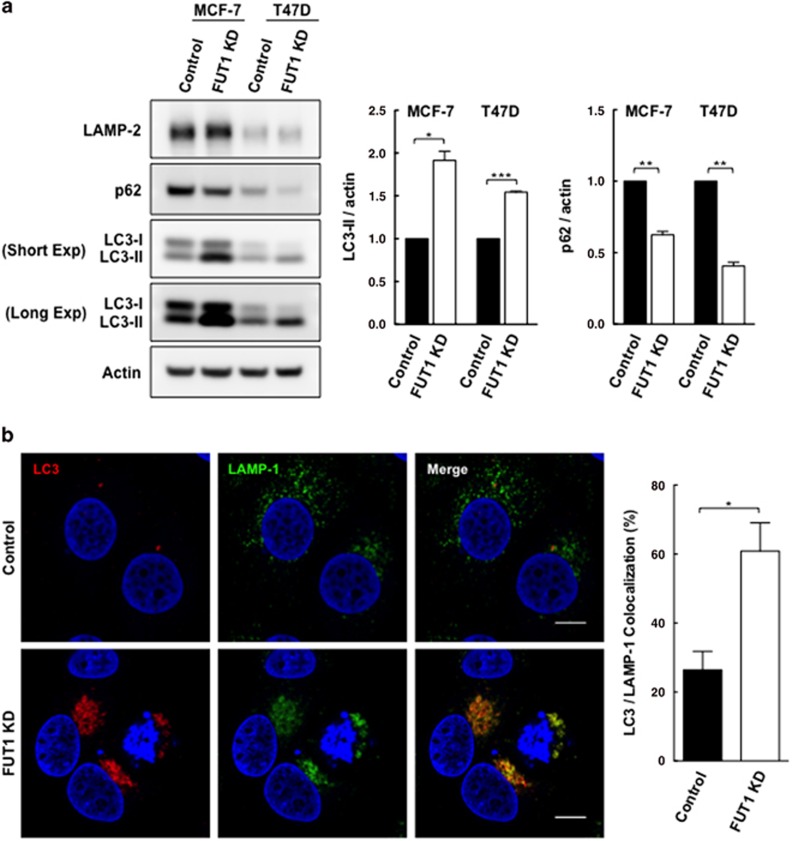
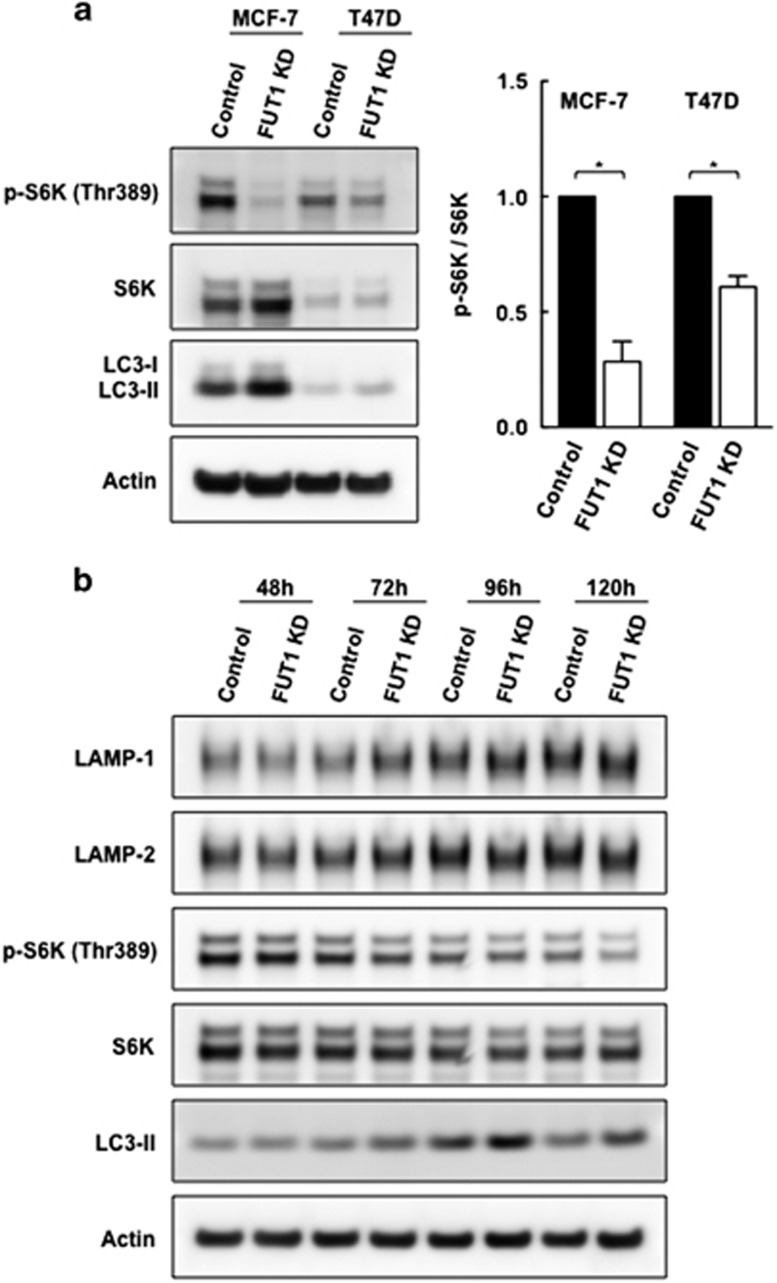
Alpha1,2-fucosyltransferases, FUT1 and FUT2, which transfer fucoses onto the terminal galactose of N-acetyl-lactosamine via α1,2-linkage have been shown to be highly expressed in various types of cancers. A few studies have shown the involvement of FUT1 substrates in tumor cell proliferation and migration. Lysosome-associated membrane protein 1, LAMP-1, has been reported to carry alpha1,2-fucosylated Lewis Y (LeY) antigens in breast cancer cells, however, the biological functions of LeY on LAMP-1 remain largely unknown. Whether or not its family member, LAMP-2, displays similar modifications and functions as LAMP-1 has not yet been addressed. In this study, we have presented evidence supporting that both LAMP-1 and 2 are substrates for FUT1, but not FUT2. We have also demonstrated the presence of H2 and LeY antigens on LAMP-1 by a targeted nanoLC-MS(3) and the decreased levels of fucosylation on LAMP-2 by MALDI-TOF analysis upon FUT1 knockdown. In addition, we found that the expression of LeY was substantial in less invasive ER+/PR+/HER- breast cancer cells (MCF-7 and T47D) but negligible in highly invasive triple-negative MDA-MB-231 cells, of which LeY levels were correlated with the levels of LeY carried by LAMP-1 and 2. Intriguingly, we also observed a striking change in the subcellular localization of lysosomes upon FUT1 knockdown from peripheral distribution of LAMP-1 and 2 to a preferential perinuclear accumulation. Besides that, knockdown of FUT1 led to an increased rate of autophagic flux along with diminished activity of mammalian target of rapamycin complex 1 (mTORC1) and enhanced autophagosome-lysosome fusion. This may be associated with the predominantly perinuclear distribution of lysosomes mediated by FUT1 knockdown as lysosomal positioning has been reported to regulate mTOR activity and autophagy. Taken together, our results suggest that downregulation of FUT1, which leads to the perinuclear localization of LAMP-1 and 2, is correlated with increased rate of autophagic flux by decreasing mTOR signaling and increasing autolysosome formation.


Figures

Figure 1
Figure 1
LAMP-1 and 2 are substrates of FUT1. (a) Expression levels of LeY antigens on immunoprecipitated LAMP-1 and 2 from control, FUT1 and FUT2 knockdown cells. Both LAMP-1 and 2 were immunoprecipitated from FUT1 and FUT2 silenced T47D cells and then immunobloted with antibodies against LeY. The same blots were stripped and reprobed for LAMP-1 or LAMP-2. The ratios of LeY to immunoprecipitated LAMP-1 or LAMP-2 were quantified and fold changes relative to control were shown as indicated. (b) Immunoblot analysis of LeY levels in MCF-7, T47D and highly metastatic MDA-MB-231 cells (left panel). Actin was used as loading control. Expression levels of LeY antigens on immunoprecipitated LAMP-1 and 2 from MCF-7, T47D and MDA-MB-231 cells (right panel). LAMP-1 and 2 were immunoprecipitated from the indicated cells, and immunobloted with anti-LeY, anti-LAMP-1 or anti-LAMP-2 antibodies used in (a)
Figure 2
Figure 2
Characterization of N-glycans on purified LAMP-1. (a) MALDI-TOF mass spectrum of permethylated N-glycans of LAMP-1 expressed in mock-treated T47D cells. The insert graph showed full range MS spectrum with predominant high-mannose and minor complex-type N-glycans on LAMP-1 glycoproteins. The bi-, tri- and tetra-antennary complex N-glycans of LAMP-1 were highly fucosylated with up to four fucose residues attached. The colored symbol and nomenclature for glycan structure follow the designation of Consortium for Functional Glycomics (http://www.functionalglycomics.org/static/consortium/Nomenclature.shtml). (b) LC-MS3 analysis of bi-antennary N-glycans of LAMP-1 from control and FUT1 knockdown T47D cells. The EICs in the left panel showed the sodiated molecular ions of bi-antennary N-glycans carried with one (m/z 1141.6, [M+2Na]2+), two (m/z 826.7, [M+3Na]3+) or three (m/z 884.8, [M+3Na]3+) fucose residues of purified LAMP-1 from mock, control or FUT1 knockdown cells. The EICs were reconstructed by ion intensities within 20 p.p.m. accuracy of theoretical mass value. The major fragment ions of H type 2 (H2), Lewis X (LeX) and LeY glycotopes are schematically illustrated on the right panel. Notably, those bi-antennary N-glycans with distinct terminal glycotopes were eluted at different retention times (RTs). The fragmentation was annotated according to the Domon and Costello nomenclature
Figure 3
Figure 3
MALDI-TOF mass spectra of complex N-glycan from purified LAMP-2 expressed in control and FUT1 knockdown T47D cells. The changes of fucosylation level on tri- and tetra-antennary N-glycans were illustrated as relative abundance of each glycoform (as shown in different shades of gray boxes). Notably, the levels of fucosylation decreased in both tri- and tetra-antennary N-glycans of LAMP-2 in FUT1 knockdown cells as compared with that in control cells. The molecular ions representing complex glycans with degree of fucosylation were highlighted in the lower spectrum as red peaks at m/z 2709, 2883 and 3057 for tri-antennary and m/z 3158, 3332 and 3506 for tetra-antennary N-glycans, respectively. The relative ratio of each glycoform is given in percentage of total sum of peak intensities of tri- and tetra-antennary glycans in the MS spectra. The colored symbol and nomenclature for glycan structure are based on the designation of Consortium for Functional Glycomics as described in Figure 2a. Peaks labeled with asterisks represent polyhexose ladder contaminations that were negligible for overall analysis
Figure 4
Figure 4
Downregulation of FUT1 leads to accumulation of LAMP-1/2(+) vesicles at perinulear area of MCF-7 and T47D cells. (a) Immunofluorescence staining for LAMP-1 in control and FUT1 knockdown cells with anti-LAMP-1 (green) and Hoechst (nucleus, blue). Stained cells were then analyzed by confocal microscopy at × 63 magnification (MCF-7 cells) and × 100 magnification (T47D cells). Scale bars, 10 μm. Histogram shows the percentage of control (black bars) and FUT1 knockdown (white bars) cells with predominantly perinuclear localization of LAMP-1. Data shown are the mean±S.E.M. of three independent experiments (***P<0.001; **P<0.01). (b) Colocalization of LAMP-1 and 2 in perinuclear area of FUT1 knockdown MCF-7 and T47D cells. Control and FUT1 silenced T47D/MCF-7 cells were co-stained with anti-LAMP-1 (green) and anti-LAMP-2 (red), and nuclei were stained with Hoechst (blue). Colocalization was visualized by confocal microscopy at × 63 magnification (MCF-7 cells) and × 100 magnification (T47D cells) with 3X optical zoom. Representative colocalization signals were shown in the merged image as yellow. Scale bars, 10 μm
Figure 5
Figure 5
Knockdown of FUT1 is associated with an increase in autophagic flux. (a) Immunoblot analysis of LC3-II and p62 levels in control and FUT1 knockdown cells. Total cell lysates from MCF-7 and T47D cells transfected with control or FUT1 siRNAs were collected at 120 and 96 h post-transfection, respectively. Equal amounts of cell lysates were then loaded in each lane and separated by SDS-PAGE. Immunoblot analysis was performed with LC3 and p62 antibodies. Actin was used as a loading control. The intensity of LC3-II and p62 protein bands on immunoblot were quantified and normalized to actin, and the relative levels of protein expression were expressed as fold change by setting the control group value to 1. Values shown are mean±S.E.M. of three independent experiments (***P<0.001; **P<0.01; *P<0.05). (b) Downregulation of FUT1 enhanced the fusion of autophagosome and lysosomes in MCF-7 cells. Cells were co-stained with anti-LAMP-1 (green) and anti-LC3 (red) and nuclei stained with Hoechst (blue). Representative colocalization signals (referred to as autolysosomes) were shown in yellow in the merged. Magnification × 63, zoom: × 3. Scale bars, 10 μm. Histogram shows the percentages of autolysosomes (LC3+/LAMP-1+) to autophagosomes (LC3+/LAMP-1). Data are mean±S.E.M. of three independent experiments of >100 cells per group (*P<0.05)
Figure 6
Figure 6
Knockdown of FUT1 is associated with decreased mTORC1 activity. (a) Representative immunoblots and quantitative analysis of mTOR activity in control and FUT1 knockdown cells. Lysates of MCF-7 and T47D cells transfected with control or FUT1 siRNAs were subjected to immunoblot analysis with antibodies against phospho-p70 S6K (Thr389) and total S6K. The resulting immunoblot bands were then quantified and computed as phospho-p70 S6K/total S6K ratio for mTOR activity. Values shown are mean fold change±S.E.M. of three independent experiments (*P<0.05). (b) Time course of mTORC1 activity in control and FUT1 knockdown MCF-7 cells. mTOR activity was determined by immunoblot analysis for the phosphorylation status of p70 S6K from 48 to 120 h after FUT1 knockdown. Levels of LAMP-1, LAMP-2 and LC3-II were analyzed in parallel over the indicated time points and actin was used as a loading control. Results are representative of two independent experiments

Similar articles

Cited by

References

    1. Goupille C, Marionneau S, Bureau V, Hallouin F, Meichenin M, Rocher J et al. Alpha1,2-fucosyltransferase increases resistance to apoptosis of rat colon carcinoma cells. Glycobiology 2000; 10: 375–382. - PubMed
    1. Marionneau S, Cailleau-Thomas A, Rocher J, Le Moullac-Vaidye B, Ruvoen N, Clement M et al. ABH and Lewis histo-blood group antigens, a model for the meaning of oligosaccharide diversity in the face of a changing world. Biochimie 2001; 83: 565–573. - PubMed
    1. Oriol R, Mollicone R, Coullin P, Dalix AM, Candelier JJ. Genetic regulation of the expression of ABH and Lewis antigens in tissues. APMIS Suppl 1992; 27: 28–38. - PubMed
    1. Aubert M, Panicot L, Crotte C, Gibier P, Lombardo D, Sadoulet MO et al. Restoration of alpha(1,2) fucosyltransferase activity decreases adhesive and metastatic properties of human pancreatic cancer cells. Cancer Res 2000; 60: 1449–1456. - PubMed
    1. Labarriere N, Piau JP, Otry C, Denis M, Lustenberger P, Meflah K et al. H blood group antigen carried by CD44V modulates tumorigenicity of rat colon carcinoma cells. Cancer Res 1994; 54: 6275–6281. - PubMed

MeSH terms