

Anatomical characterization of subcortical descending projections to the inferior colliculus in mouse
- PMID: 27560718
- PMCID: PMC5222726
- DOI: 10.1002/cne.24106
Anatomical characterization of subcortical descending projections to the inferior colliculus in mouse
Abstract
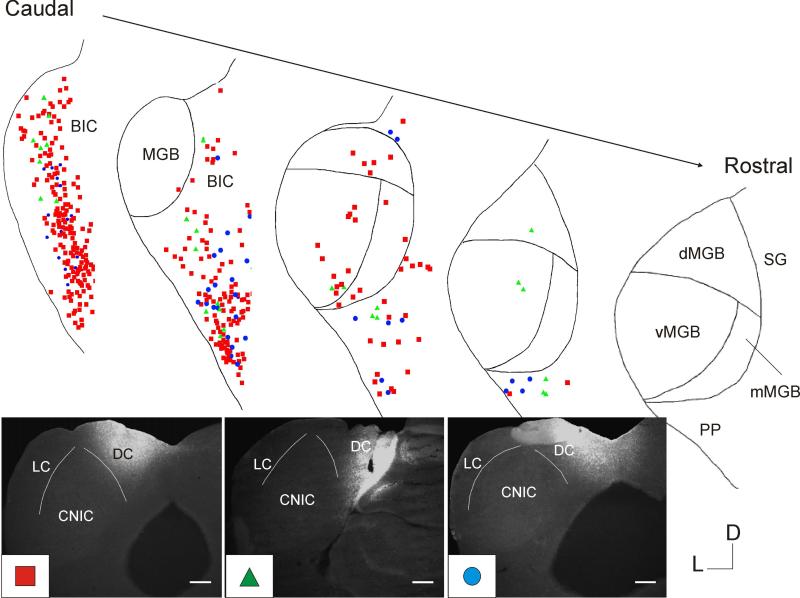
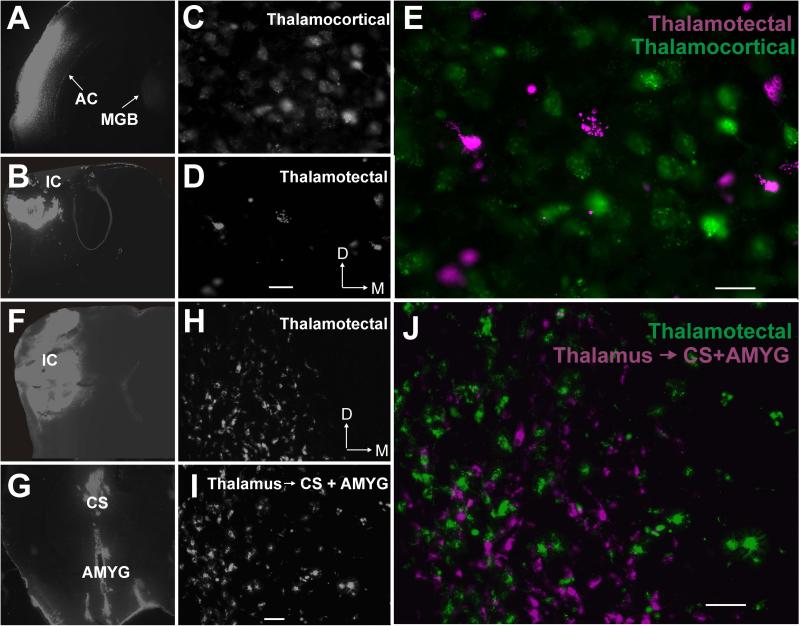
Descending projections from the thalamus and related structures to the midbrain are evolutionarily highly conserved. However, the basic organization of this auditory thalamotectal pathway has not yet been characterized. The purpose of this study was to obtain a better understanding of the anatomical and neurochemical features of this pathway. Analysis of the distributions of retrogradely labeled cells after focal injections of retrograde tracer into the inferior colliculus (IC) of the mouse revealed that most of the subcortical descending projections originated in the brachium of the IC and the paralaminar portions of the auditory thalamus. In addition, the vast majority of thalamotectal cells were found to be negative for the calcium-binding proteins calbindin, parvalbumin, or calretinin. Using two different strains of GAD-GFP mice, as well as immunostaining for GABA, we found that a subset of neurons in the brachium of the IC is GABAergic, suggesting that part of this descending pathway is inhibitory. Finally, dual retrograde injections into the IC and amygdala plus corpus striatum as well into the IC and auditory cortex did not reveal any double labeling. These data suggest that the thalamocollicular pathway comprises a unique population of thalamic neurons that do not contain typical calcium-binding proteins and do not project to other paralaminar thalamic forebrain targets, and that a previously undescribed descending GABAergic pathway emanates from the brachium of the IC. J. Comp. Neurol. 525:885-900, 2017. © 2016 Wiley Periodicals, Inc.
Keywords: GABA; RRID: AB_2619710; RRID:AB_2278725; RRID:AB_476667; RRID:AB_476894; RRID:AB_477329; RRID:IMSR_JAX:007677; RRID:SCR_001775; RRID:SCR_003070; RRID:SCR_013286; RRID:SCR_014235; RRID:SCR_014432; colliculus; thalamocollicular; thalamotectal; thalamus.
© 2016 Wiley Periodicals, Inc.
Figures


Similar articles
-
Descending projections from the inferior colliculus to the dorsal cochlear nucleus are excitatory.J Comp Neurol. 2017 Mar 1;525(4):773-793. doi: 10.1002/cne.24095. Epub 2016 Sep 2. J Comp Neurol. 2017. PMID: 27513294
-
Organization of subcortical auditory nuclei of Japanese house bat (Pipistrellus abramus) identified with cytoarchitecture and molecular expression.J Comp Neurol. 2018 Dec 1;526(17):2824-2844. doi: 10.1002/cne.24529. Epub 2018 Oct 23. J Comp Neurol. 2018. PMID: 30168138
-
Bilateral projections to the thalamus from individual neurons in the inferior colliculus.J Comp Neurol. 2019 Apr 15;527(6):1118-1126. doi: 10.1002/cne.24600. Epub 2018 Dec 30. J Comp Neurol. 2019. PMID: 30536721 Free PMC article.
-
Descending projections to the auditory midbrain: evolutionary considerations.J Comp Physiol A Neuroethol Sens Neural Behav Physiol. 2023 Jan;209(1):131-143. doi: 10.1007/s00359-022-01588-5. Epub 2022 Nov 3. J Comp Physiol A Neuroethol Sens Neural Behav Physiol. 2023. PMID: 36323876 Free PMC article. Review.
-
Subtypes of GABAergic cells in the inferior colliculus.Hear Res. 2019 May;376:1-10. doi: 10.1016/j.heares.2018.10.001. Epub 2018 Oct 4. Hear Res. 2019. PMID: 30314930 Free PMC article. Review.
Cited by
-
Diverse functions of the auditory cortico-collicular pathway.Hear Res. 2022 Nov;425:108488. doi: 10.1016/j.heares.2022.108488. Epub 2022 Mar 20. Hear Res. 2022. PMID: 35351323 Free PMC article. Review.
-
Robust and Intensity-Dependent Synaptic Inhibition Underlies the Generation of Non-monotonic Neurons in the Mouse Inferior Colliculus.Front Cell Neurosci. 2019 Apr 4;13:131. doi: 10.3389/fncel.2019.00131. eCollection 2019. Front Cell Neurosci. 2019. PMID: 31024260 Free PMC article.
-
Noncanonical Short-Latency Auditory Pathway Directly Activates Deep Cortical Layers.bioRxiv [Preprint]. 2025 Feb 11:2025.01.06.631598. doi: 10.1101/2025.01.06.631598. bioRxiv. 2025. Update in: Nat Commun. 2025 Jul 1;16(1):5911. doi: 10.1038/s41467-025-61020-9. PMID: 39829930 Free PMC article. Updated. Preprint.
-
5-HT1A Receptors Alter Temporal Responses to Broadband Vocalizations in the Mouse Inferior Colliculus Through Response Suppression.Front Neural Circuits. 2021 Aug 27;15:718348. doi: 10.3389/fncir.2021.718348. eCollection 2021. Front Neural Circuits. 2021. PMID: 34512276 Free PMC article.
-
The distribution of calbindin-D28k, parvalbumin, and calretinin immunoreactivity in the inferior colliculus of circling mouse.Anat Cell Biol. 2017 Sep;50(3):230-238. doi: 10.5115/acb.2017.50.3.230. Epub 2017 Sep 20. Anat Cell Biol. 2017. PMID: 29043102 Free PMC article.
References
-
- Adams JC. Crossed and descending projections to the inferior colliculus. Neuroscience letters. 1980;19(1):1–5. - PubMed
-
- Aitkin LM, Phillips SC. Is the inferior colliculus and obligatory relay in the cat auditory system? Neuroscience letters. 1984;44(3):259–264. - PubMed
-
- Andersen RA, Snyder RL, Merzenich MM. The Topographic Organization of Corticocollicular Projections From Physiologically identified Loci in the Al, All, and Anterior Auditory Cortical Fields of the Cat. The Journal of comparative neurology. 1980;191:179–494. - PubMed
-
- Anderson L, Malmierca M. The effect of auditory cortex deactivation on stimulus-specific adaptation in the inferior colliculus of the rat. European Journal of Neuroscience. 2013;37(1):52–62. - PubMed
-
- Appell PP, Behan M. Sources of subcortical GABAergic projections to the superior colliculus in the cat. Journal of Comparative Neurology. 1990;302(1):143–158. - PubMed
MeSH terms
Grants and funding
LinkOut - more resources
Full Text Sources
Other Literature Sources
Molecular Biology Databases
Miscellaneous
