

Comment
doi: 10.1371/journal.ppat.1005679.
eCollection 2016 Aug.
Insufficient Evidence for Rare Activation of Latent HIV in the Absence of Reservoir-Reducing Interventions
Affiliations
- PMID: 27560936
- PMCID: PMC4999146
- DOI: 10.1371/journal.ppat.1005679
Item in Clipboard
Comment
Insufficient Evidence for Rare Activation of Latent HIV in the Absence of Reservoir-Reducing Interventions
PLoS Pathog.
.
No abstract available
Conflict of interest statement
The authors have declared that no competing interests exist.
Figures
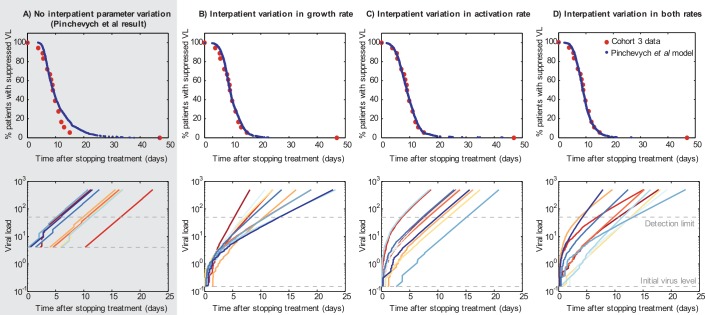
Time-to-rebound data can be explained equally well by frequent reactivation in a realistically heterogeneous cohort (Fig 1B–D) as by rare reactivation in a homogeneous population (Fig 1A). Top row: Observed rebound times in “Cohort 3” [8] and best fits from models described in text. Bottom row: Representative rebound trajectories from 10 participants randomly simulated with the best-fit parameters for each model. (A) The best-fit model derived by Pinkevych et al. All participants are identical, with k = 1/(5.1 days). We fixed r = 0.4/day and fit V
0 = 4 c/ml. (B) Allowing interperson variation in growth rate, r. We assumed the population distribution of r was log10-normal with log10-mean μr = –0.4 (10μr = 0.4/day) [,,–12] and fit the log10-standard deviation σr = 0.2 (consistent with [1,12]). We fixed k = 4 cells/day and fit V
0 = 0.15 c/ml. (C) Allowing interperson variation in the activation rate, k. We assumed the population distribution of k was log10-normal with μk = 0.6 (10μk = 4 cells/day) [1,12] and fit the log10-standard deviation σk = 0.55 (less than estimated in [1,12], similar to [13]). We fixed r = 0.4/day and fit V
0 = 0.15 c/ml. (D) Allowing interperson variation in both activation rate and growth rate. We assumed the population distribution of k and r were log10-normal. Taking μr and σr to be –0.4 (10μr = 0.4/day) and 0.1 and μk = 0.6 (10μk = 4 cells/day), we fit σk = 0.45. We additionally fit V
0 = 0.15 c/ml. For all simulations, the definition of viral rebound was set to 50 c/ml and the drug washout time to zero. In general, only two model parameters are identifiable from the cohort data and so the choice of which were fixed and which were fit was arbitrary. Higher V
0 values paired with lower r values could fit equally well, as could either paired with higher drug washout times. Note that in simulating the Pinkevych et al. model, we allow for the possibility that multiple reactivating cells contribute to viral rebound, as otherwise the model cannot be used to describe higher activation rates.
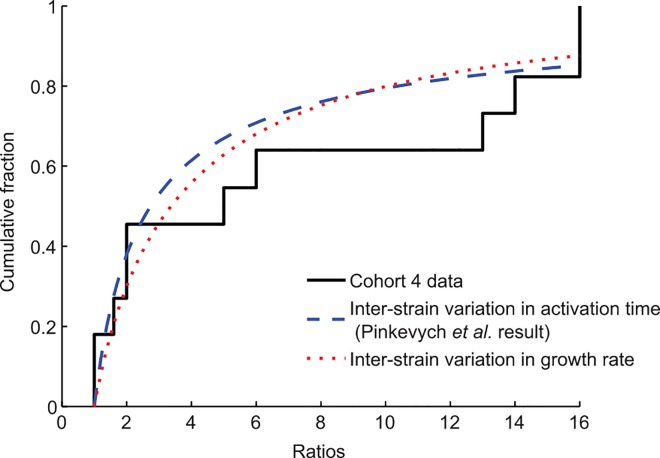
Viral genotyping during early rebound in six participants in cohort 4 [9,14] identified multiple unique viral strains contributing to rebound and characterized their relative frequencies. Ratios were defined as the number of sequences from one strain divided by the number of sequences from the next most prevalent strain. The cumulative distribution function (CDF) for the frequency of each ratio, with all participant data combined, is shown (solid black line). Pinkevych et al. used maximum likelihood estimation to determine the activation rate k that best explains this distribution, assuming all strains start at the same level and grow at the same rate once reactivated. The CDF for the ratios using their estimated activation rate (k = 1/(3.6 days)) is shown (dashed blue line). Alternatively, we assume that strains activate at the same time (high activation rate) but that the growth rates of individual strains are normally distributed with unknown mean and variance. Using maximum likelihood estimation, we infer that an interstrain standard deviation in growth rate of 0.09/day can explain the observed clone ratios (dotted red line). This estimate increases to 0.19 under alternate assumptions about the sampling procedure (see S1 Text).
Comment in
-
Modeling of Experimental Data Supports HIV Reactivation from Latency after Treatment Interruption on Average Once Every 5-8 Days.PLoS Pathog. 2016 Aug 25;12(8):e1005740. doi: 10.1371/journal.ppat.1005740. eCollection 2016 Aug. PLoS Pathog. 2016. PMID: 27560972 Free PMC article. No abstract available.
Comment on
-
Standing genetic variation and the evolution of drug resistance in HIV.PLoS Comput Biol. 2012;8(6):e1002527. doi: 10.1371/journal.pcbi.1002527. Epub 2012 Jun 7. PLoS Comput Biol. 2012. PMID: 22685388 Free PMC article.
Similar articles
-
Reversal of Latency as Part of a Cure for HIV-1.Trends Microbiol. 2016 Feb;24(2):90-97. doi: 10.1016/j.tim.2015.11.003. Epub 2015 Dec 11. Trends Microbiol. 2016. PMID: 26690612 Review.
-
Humanized Mouse Model of HIV-1 Latency with Enrichment of Latent Virus in PD-1+ and TIGIT+ CD4 T Cells.J Virol. 2019 May 1;93(10):e02086-18. doi: 10.1128/JVI.02086-18. Print 2019 May 15. J Virol. 2019. PMID: 30842333 Free PMC article.
-
Persistence of wild-type virus and lack of temporal structure in the latent reservoir for human immunodeficiency virus type 1 in pediatric patients with extensive antiretroviral exposure.J Virol. 2002 Sep;76(18):9481-92. doi: 10.1128/jvi.76.18.9481-9492.2002. J Virol. 2002. PMID: 12186930 Free PMC article.
-
Viral and latent reservoir persistence in HIV-1-infected patients on therapy.PLoS Comput Biol. 2006 Oct;2(10):e135. doi: 10.1371/journal.pcbi.0020135. Epub 2006 Aug 28. PLoS Comput Biol. 2006. PMID: 17040122 Free PMC article.
-
The latent HIV-1 reservoir in patients undergoing HAART: an archive of pre-HAART drug resistance.J Antimicrob Chemother. 2005 Apr;55(4):410-2. doi: 10.1093/jac/dki038. Epub 2005 Feb 22. J Antimicrob Chemother. 2005. PMID: 15728140 Review.
Cited by
-
Viral diversity is an obligate consideration in CRISPR/Cas9 designs for targeting the HIV reservoir.BMC Biol. 2018 Jul 11;16(1):75. doi: 10.1186/s12915-018-0544-1. BMC Biol. 2018. PMID: 29996827 Free PMC article.
-
Modeling of Experimental Data Supports HIV Reactivation from Latency after Treatment Interruption on Average Once Every 5-8 Days.PLoS Pathog. 2016 Aug 25;12(8):e1005740. doi: 10.1371/journal.ppat.1005740. eCollection 2016 Aug. PLoS Pathog. 2016. PMID: 27560972 Free PMC article. No abstract available.
-
Estimating Initial Viral Levels during Simian Immunodeficiency Virus/Human Immunodeficiency Virus Reactivation from Latency.J Virol. 2018 Jan 2;92(2):e01667-17. doi: 10.1128/JVI.01667-17. Print 2018 Jan 15. J Virol. 2018. PMID: 29118123 Free PMC article.
-
Unified model of short- and long-term HIV viral rebound for clinical trial planning.J R Soc Interface. 2021 Apr;18(177):20201015. doi: 10.1098/rsif.2020.1015. Epub 2021 Apr 14. J R Soc Interface. 2021. PMID: 33849338 Free PMC article.
-
Dynamics of latent HIV under clonal expansion.PLoS Pathog. 2021 Dec 20;17(12):e1010165. doi: 10.1371/journal.ppat.1010165. eCollection 2021 Dec. PLoS Pathog. 2021. PMID: 34929000 Free PMC article.
References
Publication types
MeSH terms
Grants and funding
- T15LM007079 /NIH/International
- P30AI060354/NIH/International
- P30 AI094189/AI/NIAID NIH HHS/United States
- U19 AI096109/AI/NIAID NIH HHS/United States
- R01AI043222 /NIH/International
- U19AI096109 /NIH/International
- R01 AI043222/AI/NIAID NIH HHS/United States
- U19 AI096113/AI/NIAID NIH HHS/United States
- AI096113 /NIH/International
- P30AI094189/NIH/International
- T15 LM007079/LM/NLM NIH HHS/United States
- DP5 OD019851/OD/NIH HHS/United States
- R01 GM117591/GM/NIGMS NIH HHS/United States
- R01GM117591 /NIH /International
- P30 AI060354/AI/NIAID NIH HHS/United States
LinkOut - more resources
Full Text Sources
Other Literature Sources
