

Comment
doi: 10.1371/journal.ppat.1005740.
eCollection 2016 Aug.
Modeling of Experimental Data Supports HIV Reactivation from Latency after Treatment Interruption on Average Once Every 5-8 Days
Affiliations
- PMID: 27560972
- PMCID: PMC4999223
- DOI: 10.1371/journal.ppat.1005740
Item in Clipboard
Comment
Modeling of Experimental Data Supports HIV Reactivation from Latency after Treatment Interruption on Average Once Every 5-8 Days
PLoS Pathog.
.
No abstract available
Conflict of interest statement
The authors have declared that no competing interests exist.
Figures
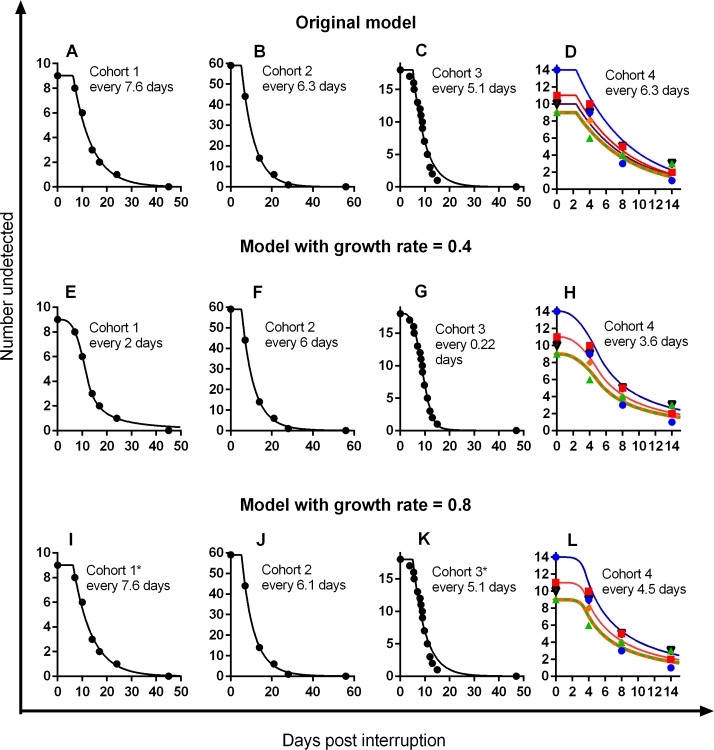
The figure compares the fitting of the best-fit reactivation rate to each of the four cohorts using the original simple two-parameter model (panels A–D) as well as the more complex model proposed by Hill et al. that incorporates multiple reactivation events and a distribution in reactivation rates. The latter is fitted using a washout time of 0 days and either Hill et al.’s proposed slow viral growth rate (g = 0.4/day) (panels E–H) or a more realistic growth rate estimated from cohort 1 (g = 0.8/day) (panels I–L). In each case, the initial viral load (V
0) and the mean and standard deviation of the reactivation rate is fitted. The average time between reactivation events is indicated for each cohort. Only for cohort 3, with a low growth rate (panel g), is estimated reactivation rate more frequent than once every 2 days. *Note: although a distribution in reactivation rates was fitted, the best fit model had a standard deviation of zero.
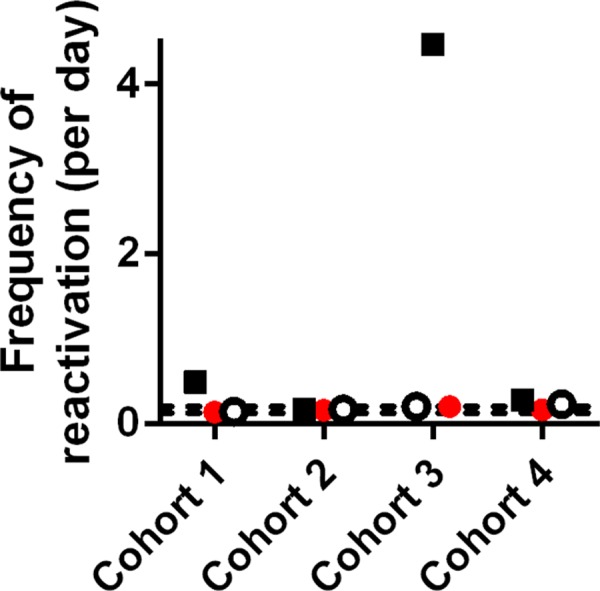
The frequency of reactivation estimated in Pinkevych et al. [2] is shown as dashed lines.
Comment on
-
Insufficient Evidence for Rare Activation of Latent HIV in the Absence of Reservoir-Reducing Interventions.PLoS Pathog. 2016 Aug 25;12(8):e1005679. doi: 10.1371/journal.ppat.1005679. eCollection 2016 Aug. PLoS Pathog. 2016. PMID: 27560936 Free PMC article. No abstract available.
Similar articles
-
Relationship between Measures of HIV Reactivation and Decline of the Latent Reservoir under Latency-Reversing Agents.J Virol. 2017 Apr 13;91(9):e02092-16. doi: 10.1128/JVI.02092-16. Print 2017 May 1. J Virol. 2017. PMID: 28202759 Free PMC article.
-
Molecular mechanisms involved in HIV-1 transcriptional latency and reactivation: implications for the development of therapeutic strategies.Bull Mem Acad R Med Belg. 2004;159(Pt 2):176-89. Bull Mem Acad R Med Belg. 2004. PMID: 15615091 Review.
-
In vitro effects of the small-molecule protein kinase C agonists on HIV latency reactivation.Sci Rep. 2016 Dec 12;6:39032. doi: 10.1038/srep39032. Sci Rep. 2016. PMID: 27941949 Free PMC article.
-
Long-Term Spontaneous Control of HIV-1 Is Related to Low Frequency of Infected Cells and Inefficient Viral Reactivation.J Virol. 2016 Jun 10;90(13):6148-6158. doi: 10.1128/JVI.00419-16. Print 2016 Jul 1. J Virol. 2016. PMID: 27122576 Free PMC article.
-
The Relevance of Post-Transcriptional Mechanisms in HIV Latency Reversal.Curr Pharm Des. 2017;23(28):4103-4111. doi: 10.2174/1381612823666170803102355. Curr Pharm Des. 2017. PMID: 28782474 Review.
Cited by
-
Models of SIV rebound after treatment interruption that involve multiple reactivation events.PLoS Comput Biol. 2020 Oct 1;16(10):e1008241. doi: 10.1371/journal.pcbi.1008241. eCollection 2020 Oct. PLoS Comput Biol. 2020. PMID: 33001979 Free PMC article.
-
Estimating Initial Viral Levels during Simian Immunodeficiency Virus/Human Immunodeficiency Virus Reactivation from Latency.J Virol. 2018 Jan 2;92(2):e01667-17. doi: 10.1128/JVI.01667-17. Print 2018 Jan 15. J Virol. 2018. PMID: 29118123 Free PMC article.
-
Controlling of pandemic COVID-19 using optimal control theory.Results Phys. 2021 Jul;26:104311. doi: 10.1016/j.rinp.2021.104311. Epub 2021 May 19. Results Phys. 2021. PMID: 34094820 Free PMC article.
-
Analytical Treatment Interruption after Short-Term Antiretroviral Therapy in a Postnatally Simian-Human Immunodeficiency Virus-Infected Infant Rhesus Macaque Model.mBio. 2019 Sep 5;10(5):e01971-19. doi: 10.1128/mBio.01971-19. mBio. 2019. PMID: 31488511 Free PMC article.
-
Viral diversity is an obligate consideration in CRISPR/Cas9 designs for targeting the HIV reservoir.BMC Biol. 2018 Jul 11;16(1):75. doi: 10.1186/s12915-018-0544-1. BMC Biol. 2018. PMID: 29996827 Free PMC article.
References
Publication types
MeSH terms
LinkOut - more resources
Full Text Sources
Other Literature Sources
