. 2016 Aug 26:6:32080.
doi: 10.1038/srep32080.

Non-invasive MRI Assessments of Tissue Microstructures and Macromolecules in the Eye upon Biomechanical or Biochemical Modulation

Affiliations

Non-invasive MRI Assessments of Tissue Microstructures and Macromolecules in the Eye upon Biomechanical or Biochemical Modulation

Leon C Ho et al. Sci Rep. .

Abstract

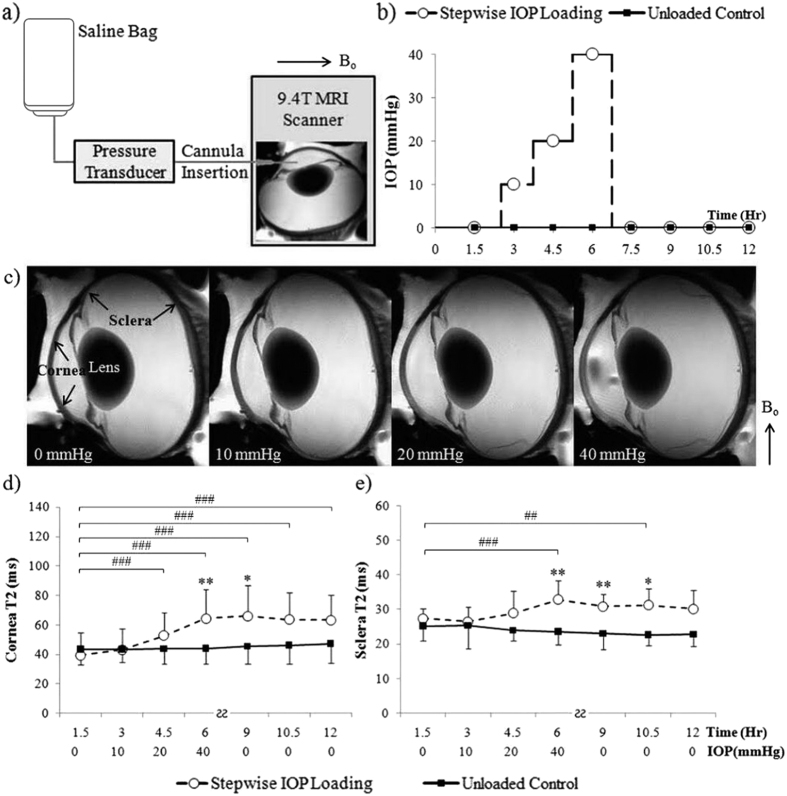
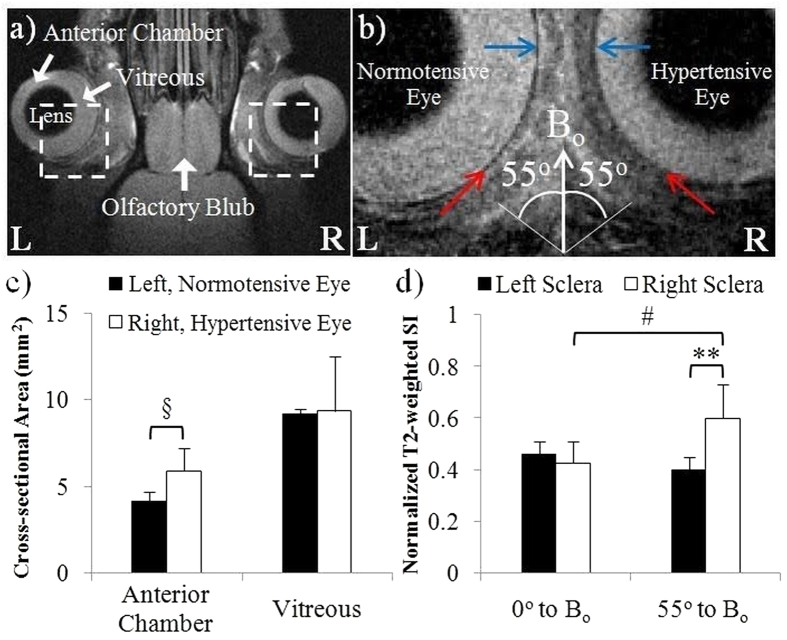
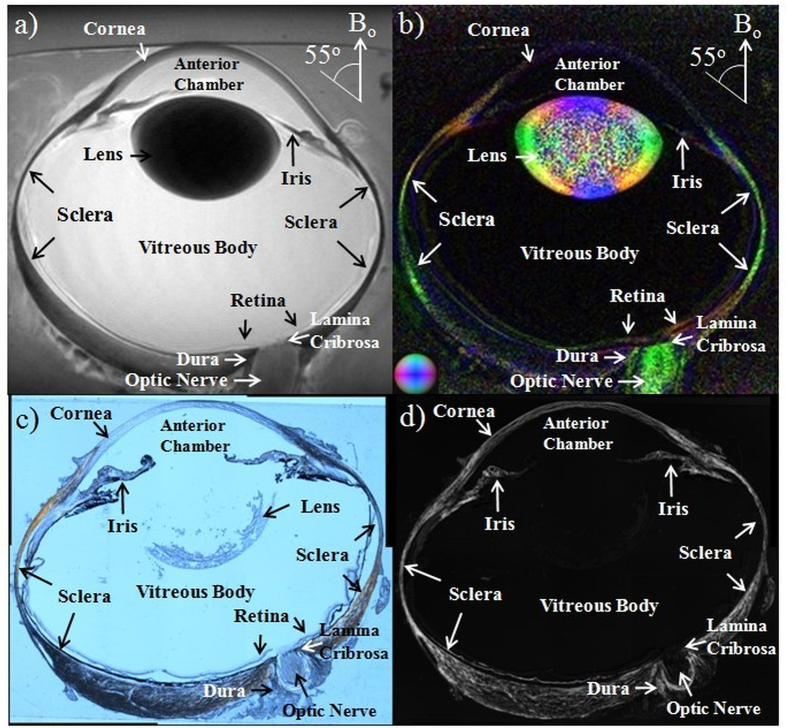
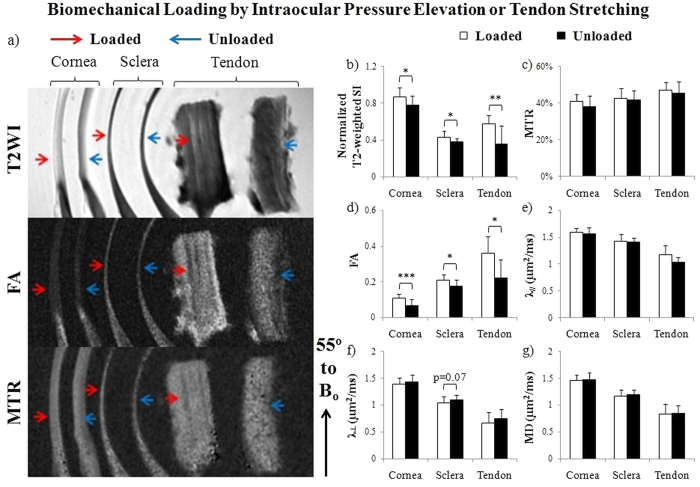
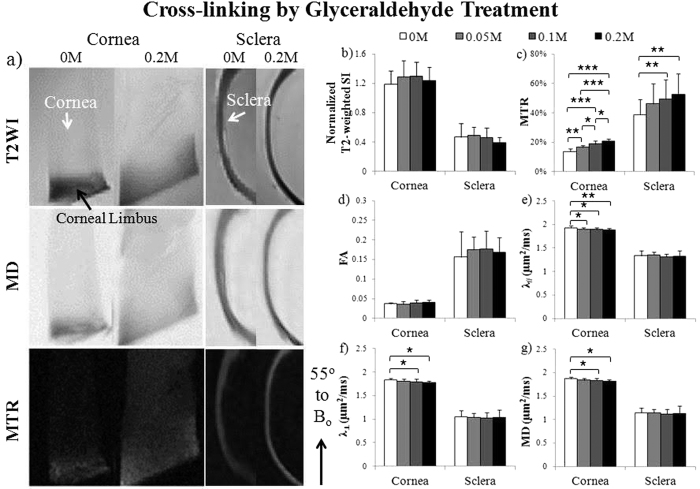
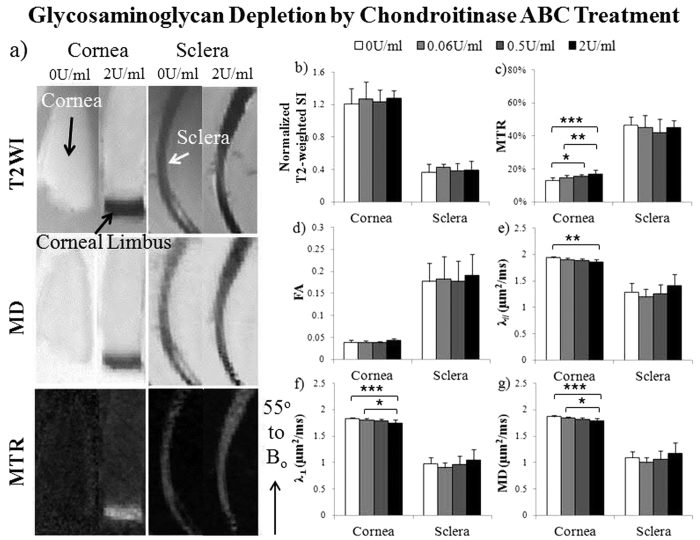
The microstructural organization and composition of the corneoscleral shell (CSS) determine the biomechanical behavior of the eye, and are important in diseases such as glaucoma and myopia. However, limited techniques can assess these properties globally, non-invasively and quantitatively. In this study, we hypothesized that multi-modal magnetic resonance imaging (MRI) can reveal the effects of biomechanical or biochemical modulation on CSS. Upon intraocular pressure (IOP) elevation, CSS appeared hyperintense in both freshly prepared ovine eyes and living rat eyes using T2-weighted MRI. Quantitatively, transverse relaxation time (T2) of CSS increased non-linearly with IOP at 0-40 mmHg and remained longer than unloaded tissues after being unpressurized. IOP loading also increased fractional anisotropy of CSS in diffusion tensor MRI without apparent change in magnetization transfer MRI, suggestive of straightening of microstructural fibers without modification of macromolecular contents. Lastly, treatments with increasing glyceraldehyde (mimicking crosslinking conditions) and chondroitinase-ABC concentrations (mimicking glycosaminoglycan depletion) decreased diffusivities and increased magnetization transfer in cornea, whereas glyceraldehyde also increased magnetization transfer in sclera. In summary, we demonstrated the changing profiles of MRI contrast mechanisms resulting from biomechanical or biochemical modulation of the eye non-invasively. Multi-modal MRI may help evaluate the pathophysiological mechanisms in CSS and the efficacy of corneoscleral treatments.


Conflict of interest statement

The author(s) have made the following disclosure(s): J.S.S.: Royalties e Zeiss, Dublin, CA (for intellectual property licensed by the Massachusetts Institute of Technology and Massachusetts Eye and Ear Infirmary).

Figures

Figure 1
Figure 1. Dynamic imaging of the effects of stepwise intraocular pressure (IOP) changes on magnetic resonance relaxometry in the corneoscleral tissues of freshly prepared ovine eyes.
(a) Schematic diagram of anterior chamber perfusion to a fresh, unfixed ovine eye in the 9.4 Tesla MRI scanner. A plastic cannula was inserted into the anterior chamber and connected to a saline bag that was risen at different heights to induce different levels of IOP elevation. (b) Experimental paradigm of the stepwise IOP loading MRI experiment and the IOP-unloaded control experiment. (c) Representative ex vivo T2-weighted MRI (T2WI) of the same ovine eye loaded at 0, 10, 20 and 40 mmHg. (d,e) Quantitative comparisons (mean ± standard deviation) of transverse relaxation time (T2) in cornea (d) and sclera (e) upon stepwise IOP loading (dashed lines) and in unloaded control (solid lines). Both cornea and sclera T2 gradually increased as IOP increased from 0 to 40 mmHg (Tukey’s multiple comparisons tests between first MRI session and subsequent sessions, ##p < 0.01, ###p < 0.001; comparisons between other sessions are not shown here for clarity) but remained unchanged after being unpressurized (Tukey’s multiple comparisons tests between MRI sessions, p > 0.05). No significant change was observed in the unloaded control tissues over time (Tukey’s tests between MRI sessions, p > 0.05) (Sidak’s multiple comparison tests between IOP loaded and unloaded control tissues: *p < 0.05, **p < 0.01) (Bo: main magnetic field).
Figure 2
Figure 2. In vivo imaging of the effects of chronic IOP elevation on the rat scleral tissues.
(a) Representative in vivo T2-weighted MRI (T2WI) of the hypertensive right eye and normotensive left eye of adult Long Evans rats at 1.5 weeks after intracameral hydrogel injection to the right eye. (b) Enlarged view of the rat eyes from the broken-line boxes in (a). Blue and red arrows in both eyes indicated the sclera tissues oriented at 0° to the main magnetic field (Bo) and near the magic angle at 55° to Bo respectively. (c) Quantitative comparisons (mean ± standard deviation) of the cross-sectional areas of the anterior chamber and vitreous between the hydrogel-injected right eye and the uninjected left eye. (d) T2-weighted signal intensities (SI) in the sclera tissues oriented at about 0° or 55° (the magic angle) to Bo in both eyes. (Sidak’s multiple comparisons tests between left and right eyes: §p < 0.05; **p < 0.01; Tukey’s multiple comparisons tests between 0° to Bo and 55° to Bo on the same eye: #p < 0.05).
Figure 3
Figure 3. Whole eye imaging and histological confirmation.
Representative (a) T2-weighted MRI, (b) color-encoded fractional anisotropy map in diffusion tensor MRI (DTI), (c) histological section imaged with polarized light microscopy, and (d) energy, or intensity-map of the collagen density parallel to the plane of the section, calculated from a series of polarized light microscopy images of the unloaded ovine eye. (Color representations for the principal diffusion directions in the color-encoded fractional anisotropy map: Blue: caudal-rostral; red: left-right; green: dorsal-ventral) (Bo: main magnetic field).
Figure 4
Figure 4. Microstructural organization and macromolecular contents of IOP-loaded sclera and cornea tissues, and stretch-loaded tendon tissues by T2-weighted MRI (T2WI), diffusion tensor MRI (DTI) and magnetization transfer MRI (MTI).
(a) Representative T2WI (top), fractional anisotropy (FA) maps (middle) and magnetization transfer ratio (MTR) maps (bottom) of loaded (red arrows) and unloaded (blue arrows) cornea, sclera and tendon tissue strips. The tissues were oriented and measured near the magic angle at ~55° to the main magnetic field (Bo) to enhance MRI signals for more sensitive examinations; (b–g) Quantitative comparisons (mean ± standard deviation) of (b) T2-weighted signal intensity (SI), (c) MTR, (d) FA, (e) axial diffusivity (λ//), (f) radial diffusivity (λ) and (g) mean diffusivity (MD) between loaded and unloaded cornea, sclera and tendon strips. ANOVA tests showed significant differences between cornea, sclera and tendon tissues under the same loading conditions for each MRI parameter in (b–g) (p < 0.05) except loaded tissues in MTR (c) (p > 0.05) (Paired t-tests between loaded and unloaded cornea or sclera: *p < 0.05, **p < 0.01; ***p < 0.001; Unpaired t-tests between loaded and unloaded tendon: *p < 0.05).
Figure 5
Figure 5. Microstructural and macromolecular changes in the fresh sclera and cornea tissues after glyceraldehyde cross-linking treatment with T2-weighted MRI (T2WI), diffusion tensor MRI (DTI) and magnetization transfer MRI (MTI).
(a) Representative T2WI (top), mean diffusivity (MD) maps (middle) and magnetization transfer ratio (MTR) maps (bottom) of cross-linked cornea (left panel) and sclera (right panel) after treating with 0.2 M glyceraldehyde solution or sham solution (0 M). The tissue strips were oriented and measured near the magic angle at ~55° to main magnetic field (Bo); (b–g) Quantitative comparisons (mean ± standard deviation) of (b) T2-weighted signal intensity (SI), (c) MTR, (d) fractional anisotropy (FA), (e) axial diffusivity (λ//), (f) radial diffusivity (λ) and (g) MD in cornea and sclera strips after treatments with glyceraldehyde cross-linking solutions at 0, 0.05, 0.10 and 0.20 M concentrations. (Tukey’s multiple comparisons tests: *p < 0.05, **p < 0.01, ***p < 0.001).
Figure 6
Figure 6. Microstructural and macromolecular changes in the fresh sclera and cornea tissues after glycosaminoglycan depletion by chondroitinase-ABC with T2-weighted MRI (T2WI), diffusion tensor MRI (DTI) and magnetization transfer MRI (MTI).
(a) Representative T2WI (top), mean diffusivity (MD) maps (middle) and magnetization transfer ratio (MTR) maps (bottom) of glycosaminoglycan removal in cornea (left panel) and sclera (right panel) after treating with 2 units/ml (U/ml) of chondroitinase-ABC solution or sham solution (0 U/ml). Tissue strips were oriented and measured about the magic angle at ~55° to main magnetic field (Bo); (b–g) Quantitative comparisons (mean ± standard deviation) of (b) T2-weighted signal intensity (SI), (c) MTR, (d) fractional anisotropy (FA), (e) axial diffusivity (λ//), (f) radial diffusivity (λ) and (g) mean diffusivity (MD) in cornea and sclera strips after treatment with chondroitinase-ABC solutions at concentrations of 0, 0.06, 0.5 and 2 U/ml. (Tukey’s multiple comparisons tests: *p < 0.05, **p < 0.01, ***p < 0.001).

Similar articles

Cited by

References

    1. Liu J. & He X. Corneal stiffness affects IOP elevation during rapid volume change in the eye. Invest Ophthalmol Vis Sci 50, 2224–2229 (2009). - PubMed
    1. Kimball E. C. et al.. Experimental scleral cross-linking increases glaucoma damage in a mouse model. Exp Eye Res 128, 129–140 (2014). - PMC - PubMed
    1. Sigal I. A. et al.. Eye-specific IOP-induced displacements and deformations of human lamina cribrosa. Investigative ophthalmology & visual science 55, 1–15 (2014). - PMC - PubMed
    1. Pijanka J. K. et al.. Changes in scleral collagen organization in murine chronic experimental glaucoma. Invest Ophthalmol Vis Sci 55, 6554–6564 (2014). - PMC - PubMed
    1. Jan N. J. et al.. Polarization microscopy for characterizing fiber orientation of ocular tissues. Biomed Opt Express 6, 4705–4718 (2015). - PMC - PubMed

Publication types