The influence of the aortic valve angle on the hemodynamic features of the thoracic aorta
- PMID: 27561388
- PMCID: PMC4999809
- DOI: 10.1038/srep32316
The influence of the aortic valve angle on the hemodynamic features of the thoracic aorta
Abstract
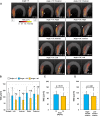
Since the first observation of a helical flow pattern in aortic blood flow, the existence of helical blood flow has been found to be associated with various pathological conditions such as bicuspid aortic valve, aortic stenosis, and aortic dilatation. However, an understanding of the development of helical blood flow and its clinical implications are still lacking. In our present study, we hypothesized that the direction and angle of aortic inflow can influence helical flow patterns and related hemodynamic features in the thoracic aorta. Therefore, we investigated the hemodynamic features in the thoracic aorta and various aortic inflow angles using patient-specific vascular phantoms that were generated using a 3D printer and time-resolved, 3D, phase-contrast magnetic resonance imaging (PC-MRI). The results show that the rotational direction and strength of helical blood flow in the thoracic aorta largely vary according to the inflow direction of the aorta, and a higher helical velocity results in higher wall shear stress distributions. In addition, right-handed rotational flow conditions with higher rotational velocities imply a larger total kinetic energy than left-handed rotational flow conditions with lower rotational velocities.
Figures


Similar articles
-
Aortic Valve Stenosis Alters Expression of Regional Aortic Wall Shear Stress: New Insights From a 4-Dimensional Flow Magnetic Resonance Imaging Study of 571 Subjects.J Am Heart Assoc. 2017 Sep 13;6(9):e005959. doi: 10.1161/JAHA.117.005959. J Am Heart Assoc. 2017. PMID: 28903936 Free PMC article.
-
Patient-specific assessment of hemodynamics by computational fluid dynamics in patients with bicuspid aortopathy.J Thorac Cardiovasc Surg. 2017 Apr;153(4):S52-S62.e3. doi: 10.1016/j.jtcvs.2016.12.033. Epub 2017 Jan 11. J Thorac Cardiovasc Surg. 2017. PMID: 28190607
-
Aortic shear stress in patients with bicuspid aortic valve with stenosis and insufficiency.J Thorac Cardiovasc Surg. 2017 Jun;153(6):1263-1272.e1. doi: 10.1016/j.jtcvs.2016.12.059. Epub 2017 Feb 10. J Thorac Cardiovasc Surg. 2017. PMID: 28268004 Free PMC article.
-
The role of 4-dimensional flow in the assessment of bicuspid aortic valve and its valvulo-aortopathies.Br J Radiol. 2022 Oct 1;95(1139):20220123. doi: 10.1259/bjr.20220123. Epub 2022 Aug 3. Br J Radiol. 2022. PMID: 35852109 Free PMC article. Review.
-
Haemodynamic assessment of bicuspid aortic valve aortopathy: a systematic review of the current literature.Eur J Cardiothorac Surg. 2019 Apr 1;55(4):610-617. doi: 10.1093/ejcts/ezy312. Eur J Cardiothorac Surg. 2019. PMID: 30239633
Cited by
-
The impact of shape uncertainty on aortic-valve pressure-drop computations.Int J Numer Method Biomed Eng. 2021 Oct;37(10):e3518. doi: 10.1002/cnm.3518. Epub 2021 Aug 23. Int J Numer Method Biomed Eng. 2021. PMID: 34350705 Free PMC article.
-
Model-Based Therapy Planning Allows Prediction of Haemodynamic Outcome after Aortic Valve Replacement.Sci Rep. 2017 Aug 29;7(1):9897. doi: 10.1038/s41598-017-03693-x. Sci Rep. 2017. PMID: 28851875 Free PMC article.
-
Influence of the tilt angle of Percutaneous Aortic Prosthesis on Velocity and Shear Stress Fields.Arq Bras Cardiol. 2017 Jul-Aug;109(3):231-240. doi: 10.5935/abc.20170115. Arq Bras Cardiol. 2017. PMID: 28793046 Free PMC article.
-
Aortic valvular imaging with cardiovascular magnetic resonance: seeking for comprehensiveness.Br J Radiol. 2019 Sep;92(1101):20170868. doi: 10.1259/bjr.20170868. Epub 2019 Jul 18. Br J Radiol. 2019. PMID: 30277407 Free PMC article. Review.
-
Prediction of Stress Map in Ascending Aorta - Optimization of the Coaxial Position in Transcatheter Aortic Valve Replacement.Arq Bras Cardiol. 2020 Oct;115(4):680-687. doi: 10.36660/abc.20190385. Arq Bras Cardiol. 2020. PMID: 32491131 Free PMC article. English, Portuguese.
References
-
- Kaneda H. Complex roles of endothelial shear stress in vascular remodeling response. Journal of the American College of Cardiology 50, 2171–2171 (2007). - PubMed
-
- DePaola N., Gimbrone M., Davies P. F. & Dewey C. Vascular endothelium responds to fluid shear stress gradients. Arteriosclerosis, Thrombosis, and Vascular Biology 12, 1254–1257 (1992). - PubMed
Publication types
MeSH terms
LinkOut - more resources
Full Text Sources
Other Literature Sources
Medical
Molecular Biology Databases

