. 2016 Aug 26:6:32093.
doi: 10.1038/srep32093.

Cell non-autonomous regulation of hepatic IGF-1 and neonatal growth by Kinase Suppressor of Ras 2 (KSR2)

Affiliations

Cell non-autonomous regulation of hepatic IGF-1 and neonatal growth by Kinase Suppressor of Ras 2 (KSR2)

Lili Guo et al. Sci Rep. .

Abstract

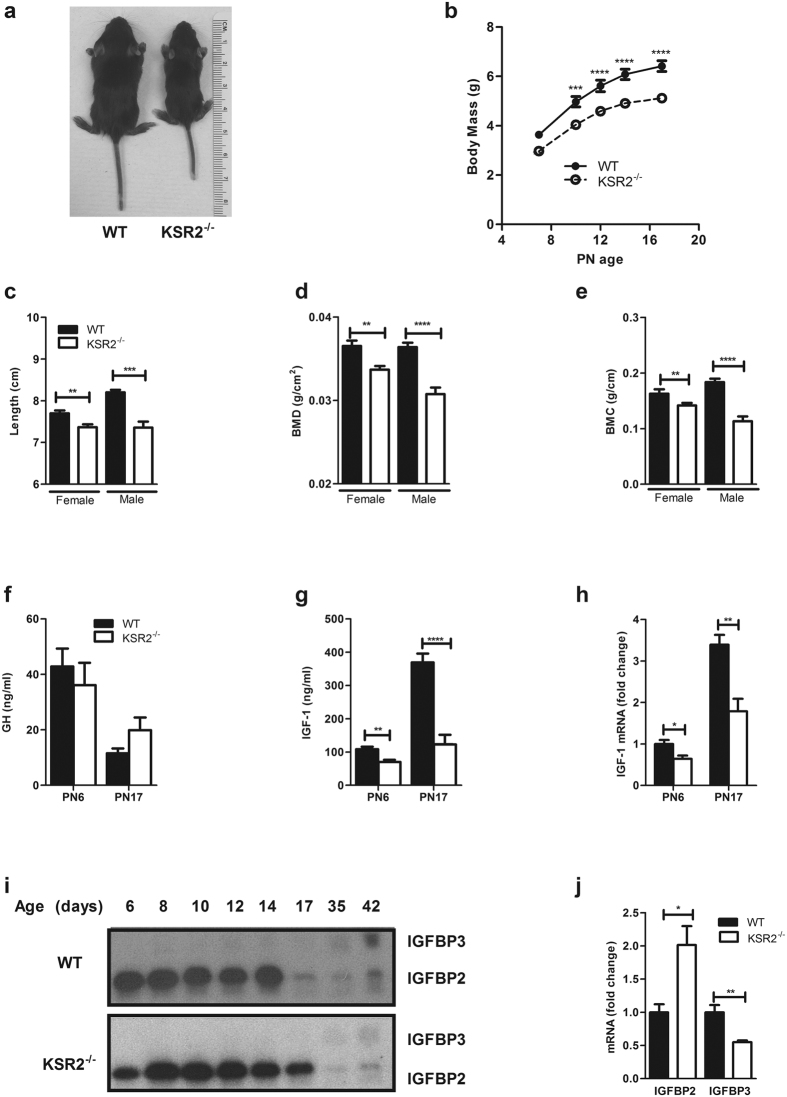
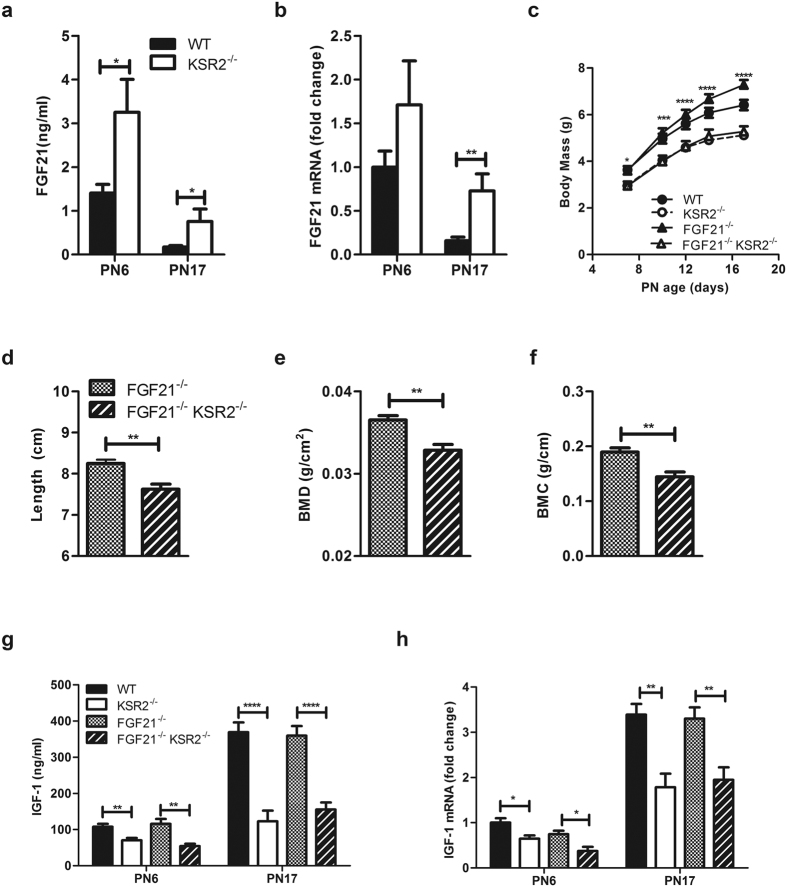
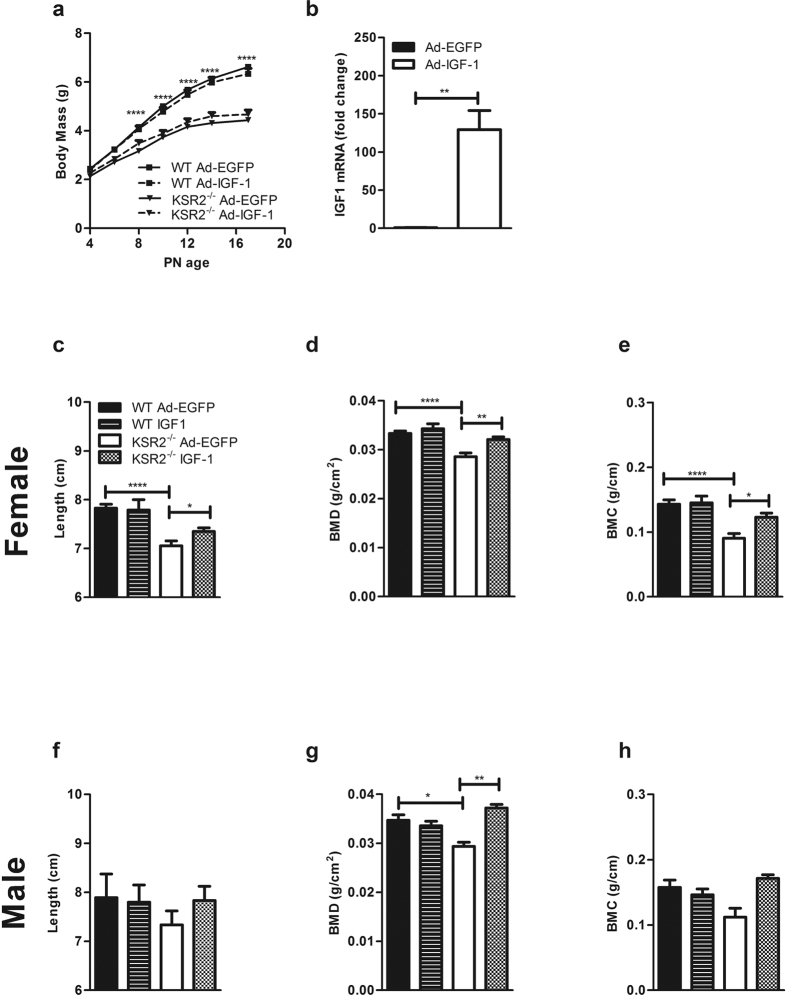
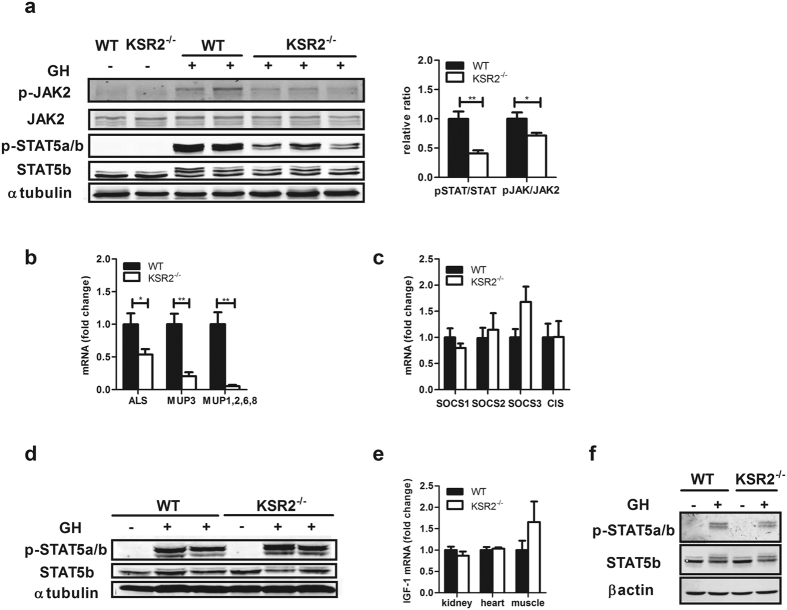
Individuals with poor postnatal growth are at risk for cardiovascular and metabolic problems as adults. Here we show that disruption of the molecular scaffold Kinase Suppressor of Ras 2 (KSR2) causes selective inhibition of hepatic GH signaling in neonatal mice with impaired expression of IGF-1 and IGFBP3. ksr2(-/-) mice are normal size at birth but show a marked increase in FGF21 accompanied by reduced body mass, shortened body length, and reduced bone mineral density (BMD) and content (BMC) first evident during postnatal development. However, disrupting FGF21 in ksr2(-/-) mice does not normalize mass, length, or bone density and content in fgf21(-/-)ksr2(-/-) mice. Body length, BMC and BMD, but not body mass, are rescued by infection of two-day-old ksr2(-/-) mice with a recombinant adenovirus encoding human IGF-1. Relative to wild-type mice, GH injections reveal a significant reduction in JAK2 and STAT5 phosphorylation in liver, but not in skeletal muscle, of ksr2(-/-) mice. However, primary hepatocytes isolated from ksr2(-/-) mice show no reduction in GH-stimulated STAT5 phosphorylation. These data indicate that KSR2 functions in a cell non-autonomous fashion to regulate GH-stimulated IGF-1 expression in the liver of neonatal mice, which plays a key role in the development of body length.


Figures

Figure 1
Figure 1. ksr2−/− mice exhibit low serum IGF-1 and neonatal growth defects.
(a) PN17 WT and ksr2−/− mice littermates. (b) Growth curves of WT and ksr2−/− mice from PN6 to PN17 (n = 11 WT group, n = 15 ksr2−/− group, two-way ANOVA with repeated measures Bonferoni post hoc test). (c–e) Nose-to-anus length (c), bone mineral density (BMD) (d), and bone mineral content (BMC) (e) of WT and ksr2−/− male and female mice at 5 weeks of age (n = 16, 15, 16, and 8, respectively). (f) Serum GH of WT and ksr2−/− mice at PN6 (n = 7 per group) and PN17 (n = 9 per group). (g) Serum IGF-1 of WT and ksr2−/− mice at PN6 and PN17. (n = 9, 7, 12, and 8, respectively). (h) Hepatic IGF-1 mRNA levels in WT and ksr2−/− mice at PN6 and PN17 (n = 6–7 per group). For comparison, IGF-1 levels of WT mice at PN6 were set to 1 and rps18 was used as an internal control. (i) Analysis of serum IGFBPs from WT and ksr2−/− mice. Aliquots (0.5 μl) of serum prepared from animals at the indicated postnatal times were subjected to ligand blot analysis probed with 125I-IGF2. The data shown are representative of duplicate runs for each of 3 distinct sets of serum samples. (j) IGFBP2 and IGFBP3 mRNA levels were measured by qPCR in PN17 liver tissue (n = 4–6 per group). Levels of WT mice were set to 1. Rps18 was used as an internal control. Data are shown as mean ± SEM. *p < 0.05, **p < 0.01, ***p < 0.001, ****p < 0.0001.
Figure 2
Figure 2. FGF21 disruption does not rescue the neonatal growth defect of ksr2−/− mice.
(a) Serum FGF21 levels in PN6 and PN17 WT and ksr2−/− littermates (n = 6–9 per group). (b) Hepatic FGF21 mRNA in PN6 and PN17 WT and ksr2−/− littermates (n = 6, 6, 10, and 9 respectively). Levels of WT mice at PN6 were set to 1 and rps18 was used as an internal control. (c) Growth curves of PN6 to PN17 WT, ksr2−/−, fgf21−/−, and fgf21−/− ksr2−/− male and female mice (n = 10–15 per group, two- way ANOVA with repeated measures Bonferoni post hoc test was used). (d–f) Nose-to-anus length (d), bone mineral density (e), and bone mineral content (f) of male fgf21−/− and fgf21−/− ksr2−/− mice at 5 weeks of age (n = 8 per group). (g) Serum IGF-1 levels from male and female mice of the indicated genotypes at PN6 (n = 9, 7, 5, and 7 respectively) and PN17 (n = 12, 8, 9, and 12, respectively). (h) Hepatic IGF-1 mRNA levels from male and female mice of the indicated genotypes at PN6 (n = 4–6 per group) and PN17 (n = 7 per group). For comparison, IGF-1 levels of WT at PN6 were set to 1 and rps18 was used as an internal control. Data are shown as mean ± SEM. *p < 0.05, **p < 0.01, ***p < 0.001, ****p < 0.0001
Figure 3
Figure 3. Exogenous IGF-1 rescues the defects in length and bone development, but not the mass of ksr2−/− mice.
(a) Growth curves of WT and ksr2−/− injected with AdRSVeGFP (Ad-EGFP) or AdRSVhIGF-1 (Ad-IGF-1) adenovirus at PN2 (n = 16–21 per group, two-way ANOVA with repeated measures Bonferoni post hoc test was used). (b) Total IGF-1 (mouse and human) mRNA expression in PN5 ksr2+/− liver (n = 4–6 per group). For comparison, the average IGF-1 mRNA level of Ad-EGFP-injected PN5 mice was set to 1. Rps18 was used as an internal control. (ce). Nose-to-anus length (c), bone mineral density (d), and bone mineral content (e) at 5 weeks of age of WT and ksr2−/− female mice injected with control or IGF-1-encoding adenovirus (n = 17, 7, 8, and 10 respectively). (f–h) Nose-to-anus length (f), bone mineral density (g), and bone mineral content (h) at 5 weeks of age of WT and ksr2−/− male mice injected with control or IGF-1-encoding adenovirus (n = 10, 10, 3, 3, respectively). One-way ANOVA with Bonferroni post-test with multiple comparisons was used to analyze the data in panels c-h. Data are shown as mean ± SEM. *p < 0.05, **p < 0.01, ***p < 0.001, ****p < 0.0001.
Figure 4
Figure 4. A cell non-autonomous action of KSR2 is required for GH signaling in the liver.
(a) Hepatic STAT5b and JAK2 phosphorylation in PN17 WT and ksr2−/− mice 15 min after IP injection of PBS or 125 μg/kg recombinant human GH. Liver tissue was lysed and analyzed via western blot with the indicated antibodies. The ratio of phosphorylation to total STAT5 and JAK2 was analyzed by LI-COR Odyssey system (n = 4–5 per group). Quantification is shown to the right of the western blot. (b) STAT5 target genes ALS, MUP3, and MUP1/2/6/8 were measured in livers from PN17 WT and ksr2−/− mice (n = 4–6 per group). WT levels were set to 1. *p < 0.05, **p < 0.01. (c) qPCR of SOCS1-3 and CIS mRNAs from WT and ksr2−/− liver (n = 6–8 per group). For comparison, levels of WT were set to 1 and rps18 was used as an internal control. (d) Muscle STAT5b phosphorylation in PN17 WT and ksr2−/− mice treated as in panel a. (e) IGF-1 mRNA levels from kidney, heart, and muscle of PN17 WT and ksr2−/− mice (n = 3–4 per group). IGF-1 levels of WT were set to 1, and 18srRNA was used as an internal control. (f) STAT5 phosphorylation in primary hepatocytes from PN17 WT and ksr2−/− liver treated for 5 min with 100 ng/ml GH. Results are representative of three independent experiments. Data are shown as mean ± SEM. *p < 0.05, **p < 0.01.

References

    1. Barker D. J. The developmental origins of insulin resistance. Hormone research 64 Suppl 3, 2–7, 10.1159/000089311 (2005). - DOI - PubMed
    1. Eriksson J. G., Forsen T. J., Osmond C. & Barker D. J. Pathways of infant and childhood growth that lead to type 2 diabetes. Diabetes care 26, 3006–3010 (2003). - PubMed
    1. Hales C. N. & Barker D. J. The thrifty phenotype hypothesis. British medical bulletin 60, 5–20 (2001). - PubMed
    1. Gluckman P. D. & Hanson M. A. The developmental origins of the metabolic syndrome. Trends in endocrinology and metabolism: TEM 15, 183–187, 10.1016/j.tem.2004.03.002 (2004). - DOI - PubMed
    1. Langley-Evans S. C. Developmental programming of health and disease. The Proceedings of the Nutrition Society 65, 97–105 (2006). - PMC - PubMed

Publication types

MeSH terms