. 2016 Aug 26:7:12645.
doi: 10.1038/ncomms12645.

Integrative proteomic profiling of ovarian cancer cell lines reveals precursor cell associated proteins and functional status

Affiliations

Integrative proteomic profiling of ovarian cancer cell lines reveals precursor cell associated proteins and functional status

F Coscia et al. Nat Commun. .

Abstract

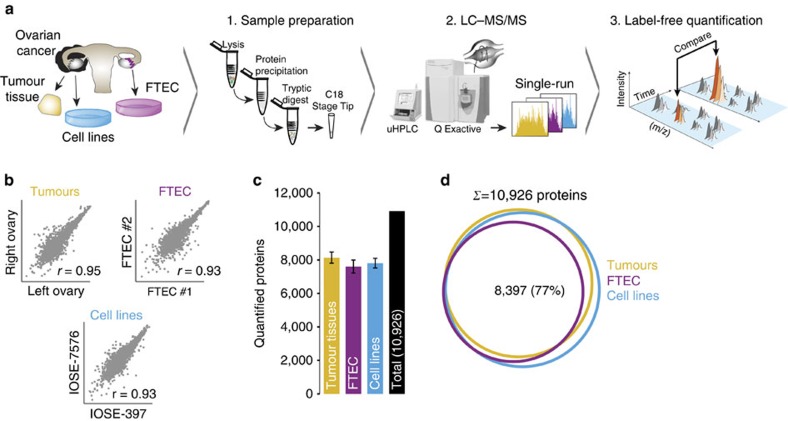
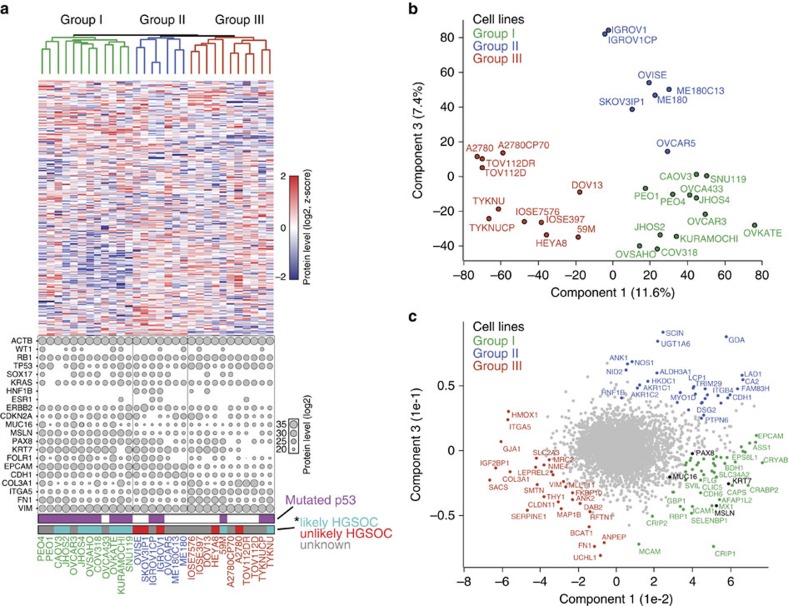
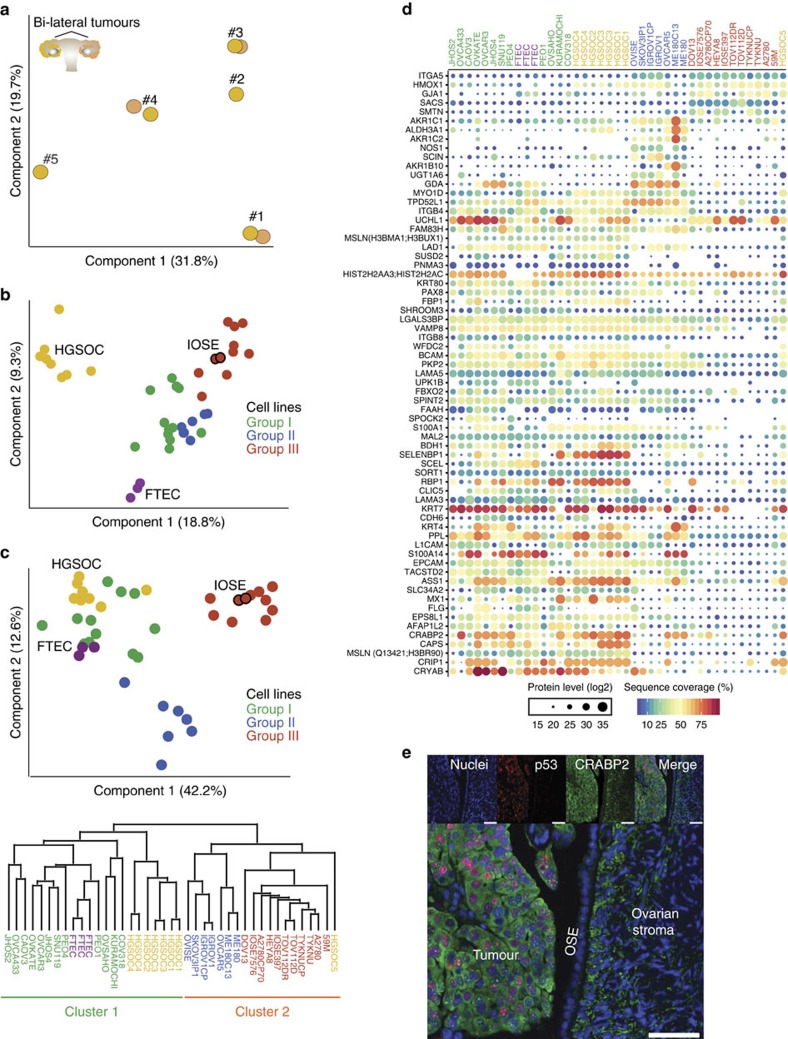
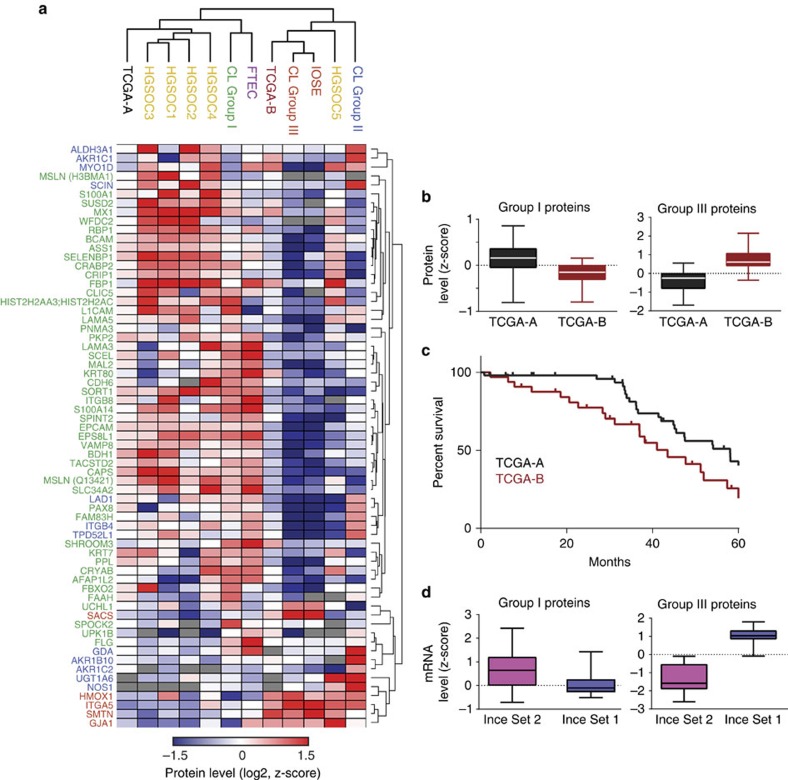
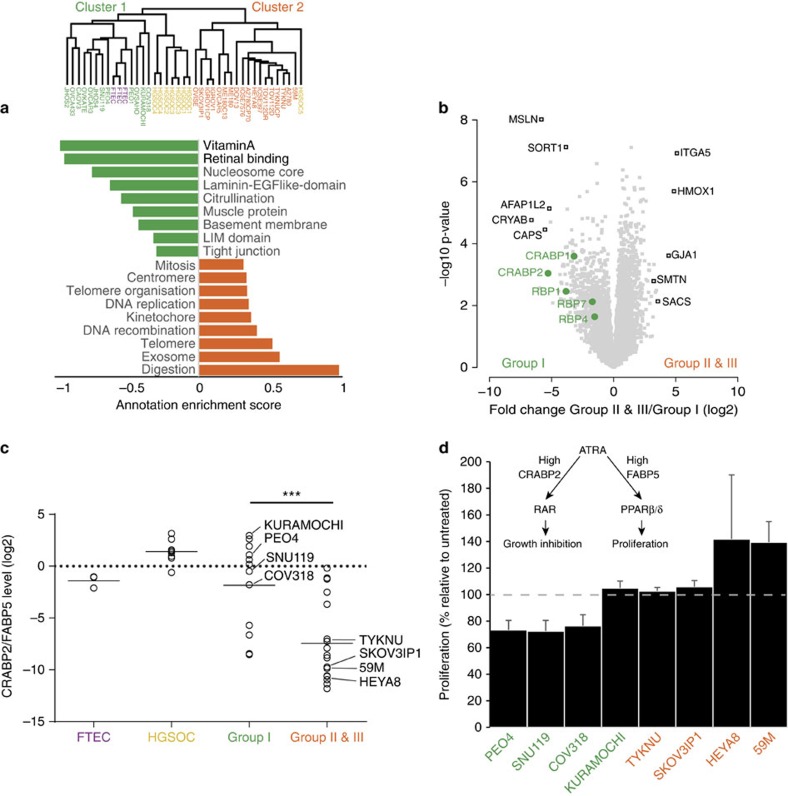
A cell line representative of human high-grade serous ovarian cancer (HGSOC) should not only resemble its tumour of origin at the molecular level, but also demonstrate functional utility in pre-clinical investigations. Here, we report the integrated proteomic analysis of 26 ovarian cancer cell lines, HGSOC tumours, immortalized ovarian surface epithelial cells and fallopian tube epithelial cells via a single-run mass spectrometric workflow. The in-depth quantification of >10,000 proteins results in three distinct cell line categories: epithelial (group I), clear cell (group II) and mesenchymal (group III). We identify a 67-protein cell line signature, which separates our entire proteomic data set, as well as a confirmatory publicly available CPTAC/TCGA tumour proteome data set, into a predominantly epithelial and mesenchymal HGSOC tumour cluster. This proteomics-based epithelial/mesenchymal stratification of cell lines and human tumours indicates a possible origin of HGSOC either from the fallopian tube or from the ovarian surface epithelium.


Figures

Figure 1
Figure 1. Deep single-run proteomics of cell lines and human ovarian cancer tissue.
(a) Summary of the shotgun proteomics workflow for OvCa cellular models and high-grade serous ovarian cancer (HGSOC) tissues. Following lysis, protein purification, and tryptic digest, peptides were separated by ultra-high performance liquid chromatography and measured in single runs using a quadrupole Orbitrap mass spectrometer. Label-free proteome quantification was performed using the MaxQuant software environment. (b) Workflow reproducibility for cell lines (n=30), HGSOC tissues (n=8) and primary FTEC cells (n=3). Pearson correlations (r) were calculated for biological replicates of cell lines, primary FTEC isolates from different healthy donors, and ovarian tumour tissues from both ovaries from a woman with HGSOC. (c) Average number of quantified proteins from each sample type. Error bars represent standard deviations. (d) Number of proteins common to FTECs, HGSOC tumours and cell lines. FTEC, fallopian tube epithelial cell; LC-MS/MS, liquid chromatography tandem mass spectrometry; m/z, mass-to-charge ratio; uHPLC, ultra-high performance liquid chromatography.
Figure 2
Figure 2. Proteomic analysis reveals proteome diversity across frequently used OvCa cell lines.
(a) Total number of quantified proteins in 26 OvCa cell lines, two immortalized ovarian surface epithelial cell lines (IOSE) and two cervical cancer cell lines (n=3 measurements for each cell line). A median depth of 7,812 quantified proteins across all the samples was obtained. (b) Quantification of proteins with low and high standard deviation (s.d.) across all the 30 cell lines identified constantly or variably expressed proteins. Protein level variability (s.d., log10) and protein intensity (sum of the intensity-based absolute quantification (iBAQ) values, log10, calculated by MaxQuant) were compared for each protein in all cell lines. An s.d. cut-off of 0.5 was used to identify proteins with the highest variability (13% of total proteins; s.d.>0.5; dashed line). Proteins frequently altered in OvCa are highlighted in blue. Proteins associated with ribosome biogenesis (Gene Ontology Biological Process), shown in green, display small differences in expression across cell lines. CDKN2A is depicted twice, representative of two different isoforms. (c) Known genomic alterations are captured at the protein level. The relative protein intensities (MaxLFQ) for proteins whose genes have known amplification events in OvCa cell lines are depicted in red. HNF1B, an ovarian CCC marker, is shown in orange. (d) Coverage of cancer-related KEGG pathways. KEGG annotations, including cancer-related pathways, were applied to the data. Percentages of pathway coverage in the indicated cancer-related KEGG categories are shown. Pathways involved in DNA replication and DNA repair, as well as metabolic annotations such as the citric acid cycle or fatty acid metabolism were almost completely covered (>80%). Signalling pathways such as mTOR, p53 or TGF-β signalling are largely covered by >60%. (e) Pathway enrichment analysis using Fisher's exact test (Benjamini–Hochberg false discovery rate <2%) was performed for the proteins with the highest expression variability (proteins above dashed line in b).
Figure 3
Figure 3. Proteomic clustering reveals three distinct cell line groups.
(a) Unsupervised hierarchical clustering was carried out on the basis of the relative expression of 8,487 proteins, delineating three major cell line groups (group I, green; group II, blue; group III, red). The relative expression levels of 15 frequently altered proteins in OvCa are plotted for each of the 30 cell lines. Levels of known OvCa-related proteins (VIM, FN1, EPCAM, CDH1 and CDKN2A) are also plotted. Relative protein levels are depicted by circle size. Relative ACTB levels are included for reference. * ‘likely HGSOC' (teal) and ‘unlikely HGSOC' (red) refer to the descriptions of these cell lines based on their genomic profiles as reported by Domcke et al.; ‘unknown' cell lines in grey were not analysed in that study. (b) The presence of three major cell line groups was confirmed by principal component analysis (PCA) of the 30 cell lines. (c) Proteins driving the PCA separation. The driver proteins from the three groups are identified on the PCA. Known HGSOC proteins MUC16, PAX8, KRT7 and MSLN are highlighted in black.
Figure 4
Figure 4. Integrative analysis of HGSOC tissue and cell line proteomes.
(a) Proteomic clustering of eight HGSOC tissue specimens. PCA was performed on the ovarian tumour specimens (n=8) based on the proteomic profiles to evaluate inter-patient heterogeneity and intra-patient homogeneity. Component 1 and component 2 account for 51.5% of the total data variation. (b) PCA clustering of cell lines (n=30), FTEC (n=3) and HGSOC tissue proteomes (n=8). Groups I (green), II (blue) and III (red) are as defined in Fig. 3. The juxtaposition of the IOSE cell lines, red circles outlined in black, relative to the rest of the group III cell lines is indicated. Component 1 and component 2 account for 28.1% of the total data variation. (c) PCA segregation and clustering of all samples based on the 67-protein signature. The juxtaposition of the IOSE cell lines, red circles outlined in black, relative to the rest of the group III cell lines is indicated. Component 1 and component 2 account for 54.8% of the total data variation. The dendrogram below the PCA summarizes the hierarchical clustering analysis of all samples based on the 67-protein signature. Two main clusters were obtained based on this signature (detailed in Supplementary Fig. 3c). (d) Relative levels of the 67 proteins used for PCA clustering in c. Relative protein levels (MaxLFQ intensities, log2) are depicted by circle size. Colours indicate protein sequence coverage per sample. MSLN is depicted twice, representative of two different isoforms (shown in parentheses). (e) Immunofluorescence staining for CRABP2 and p53 in formalin-fixed paraffin-embedded (FFPE) sections of normal OSE and ovary HGSOC tumour. FFPE sections were stained with an anti-CRABP2 antibody and an anti-p53 antibody, and detected with Alexa Fluor 488- and Alexa Fluor 647-labelled antibodies, respectively. Merged images on the bottom show invasive HGSOC, normal OSE and normal ovarian stroma in the same frame. Scale bar, 50 μM.
Figure 5
Figure 5. Clustering of the TCGA tumours based on the 67-protein cell line signature.
Hierarchical clustering summary of 84 TCGA tumours with the cell lines, FTECs, IOSEs and HGSOC-1 to -5. (a) Hierarchical clustering based on the 67-protein signature was applied to the publically available proteomic profiles of 84 TCGA tumours, and our own data set comprises the cell lines, FTECs, IOSEs and HGSOC-1 to -5 (Supplementary Fig. 5). The average protein levels for each sample group are shown. (b) Group I and group III proteins are higher in TCGA-A and TCGA-B tumours, respectively. Z-scored protein levels of group I and group III proteins were plotted as box plots for TCGA-A and TCGA-B tumours. (c) TCGA-B tumours (maroon line) are associated with a poorer overall survival compared with TCGA-A tumours (black line). Kaplan–Meier overall survival curves were plotted for patients in TCGA-A or TCGA-B. Survival associated with TCGA-B was significantly lower than that associated with TCGA-A (43.5 months versus 58 months, Mantel–Cox P value=0.0048). (d) The mRNA levels of group I and group III proteins were analysed in a publically available mRNA data set containing two different primary ovarian cancer cell line clusters. Box plots show higher median mRNA levels of group I proteins in the favourable (Ince Set 2) and relatively lower in the unfavourable (Ince Set 1) survival-associated sets, while the converse is true for group III proteins.
Figure 6
Figure 6. Proteomic profiles predict functional cell line properties.
(a) Pairwise comparison of enriched annotations for group I (cluster 1) and groups II and III (cluster 2) cell lines. Pathway enrichment analysis was calculated on the basis of the protein expression fold change between group I and groups II and III cell lines. Green and orange bars denote the strongest enriched pathways (Benjamini–Hochberg FDR<0.02) in group I and groups II and III cell lines, respectively. Annotation enrichment position score, between −1 and 1, indicates the centre of the protein distribution for each significant category, relative to the overall distribution of values. Dendrogram shows sample clustering, based on the 67-protein signature. (b) Volcano plot of the pairwise comparison between group I and groups II and III cell line proteomes. Expression fold changes (t-test difference, log2) were calculated and plotted against the t-test P value (−log10). Vitamin A pathway-associated proteins are highlighted in green. Their position on the left side of the plot indicates their higher expression in group I cell lines (P=0.003). Strongest outlier proteins for both groups are marked in black. (c) Relative protein levels of the retinoic acid transporter proteins CRABP2 and FABP5 were compared between FTECs, HGSOC, group I cell lines and groups II and III cell lines. The CRABP2/FABP5 ratios are shown. Groups II and III cell lines show significantly lower levels of CRABP2 expression relative to FABP5 (two-sided t-test, P value <0.001). The cell lines used in subsequent proliferation experiments (d) are indicated. (d) ATRA treatment induces growth arrest or differentiation in group I cell lines. Group I (green) and groups II and III (orange) cell lines were treated with 7 μM ATRA daily for 7 days. On day 8, MTT assays were performed. Results are plotted as the proliferation rate of ATRA-treated cells relative to that of untreated cells. Values <100% indicate growth arrest; values >100% indicate growth promotion. Error bars represent standard errors for two to four replicates per cell line. A simplistic model of the ATRA pathway is shown. ATRA, all-trans retinoic acid; PPAR, peroxisome proliferator-activated receptor; RAR, retinoic acid receptor.

References

    1. Koonings P. P., Campbell K., Mishell D. R. Jr & Grimes D. A. Relative frequency of primary ovarian neoplasms: a 10-year review. Obstet. Gynecol. 74, 921–926 (1989). - PubMed
    1. Callahan M. J. et al.. Primary fallopian tube malignancies in BRCA-positive women undergoing surgery for ovarian cancer risk reduction. J. Clin. Oncol. 25, 3985–3990 (2007). - PubMed
    1. Kindelberger D. W. et al.. Intraepithelial carcinoma of the fimbria and pelvic serous carcinoma: evidence for a causal relationship. Am. J. Surg. Pathol. 31, 161–169 (2007). - PubMed
    1. Piek J. M. et al.. Dysplastic changes in prophylactically removed fallopian tubes of women predisposed to developing ovarian cancer. J. Pathol. 195, 451–456 (2001). - PubMed
    1. Bowtell D. D. et al.. Rethinking ovarian cancer II: reducing mortality from high-grade serous ovarian cancer. Nat. Rev. Cancer 15, 668–679 (2015). - PMC - PubMed

Publication types