. 2016 Dec:143:26-39.
doi: 10.1016/j.neuroimage.2016.08.047. Epub 2016 Aug 22.

Adult age differences in subcortical myelin content are consistent with protracted myelination and unrelated to diffusion tensor imaging indices

Affiliations

Adult age differences in subcortical myelin content are consistent with protracted myelination and unrelated to diffusion tensor imaging indices

Muzamil Arshad et al. Neuroimage. 2016 Dec.

Abstract

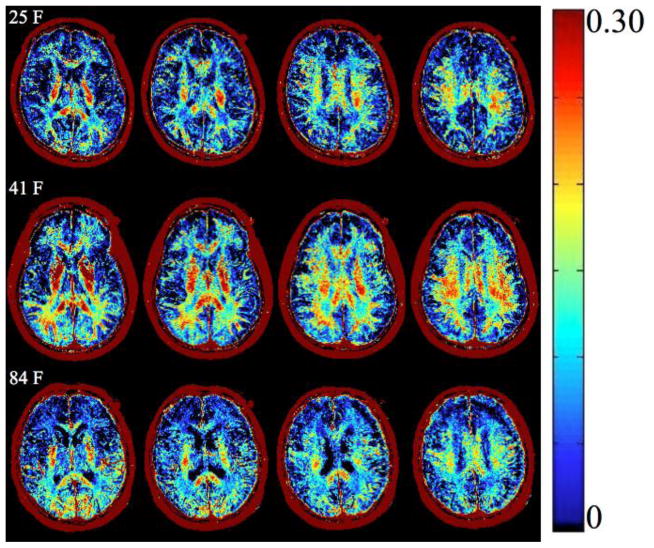
Post mortem studies suggest protracted myelination of subcortical white matter into the middle age followed by gradual decline in the late adulthood. To date, however, establishing the proposed inverted-U pattern of age-myelin association proved difficult, as the most common method of investigating white matter, diffusion tensor imaging (DTI), usually reveals only linear associations between DTI indices and age among healthy adults. Here we use a novel method of estimating Myelin Water Fraction (MWF) based on modeling the short spin-spin (T2) relaxation component from multi-echo T2 relaxation imaging data and assess subcortical myelin content within six white matter tracts in a sample of healthy adults (N=61, age 18-84 years). Myelin content evidenced a quadratic relationship with age, in accord with the pattern observed postmortem studies. In contrast, DTI-derived indices that are frequently cited as proxies for myelination, fractional anisotropy (FA) and radial diffusivity (RD), exhibited linear or null relationships with age. Furthermore, the magnitude of age differences in MWF varied across the white matter tracts. Myelin content estimated by MWF was unrelated to FA and correlated with RD only in the splenium. These findings are consistent with the notion that myelination continues throughout the young adulthood into the middle age. The results demonstrate that single-tensor DTI cannot serve as a source of specific proxies for myelination of white matter tracts.

Keywords: Aging; Brain; Fractional Anisotropy; Multi-exponential T(2) relaxation; White Matter.


Conflict of interest statement

statement The authors of this publication have no conflicts to disclose.

Figures

Figure 1
Figure 1
A summary of the principles of Myelin Water Fraction imaging. The measured MRI signal originates from the myelin, intra-axonal, and extra-axonal (IE) water compartments (A). By decomposing the measured multi-exponential T2 decay signal into the components of T2 relaxation times, the short-T2 water signal from the myelin compartment can be quantified and its fraction in the total signal can be computed (B). Mean values for the short and intermediate components are indicated on the graph. Values on axes Y are in arbitrary units (AU).
Figure 2
Figure 2
Regions of interest mapped from standard space onto subject space for myelin quantification. The same regions were used in the DTI analysis. ROIs in subject space for a representative participant are shown below, left to right: (A.) Genu of the corpus callosum (1), Anterior limb of the internal capsule (2), Posterior limb of the internal capsule (3) and Splenium of the corpus callosum (4). The middle axial slice (B.) Superior longitudinal fasciculus (5), and (C.) Inferior fronto-occipital fasciculus (6).
Figure 3
Figure 3
Representative example of MWF maps of participants in early, mid, and late adulthood. This figure depicts myelin content expressed as MWF values (scale on the right) across the adult life span in three representative individuals. All MWF images, across persons, are from anatomically identical slices. Visual inspection reveals greater myelin content in middle age compared to early and late adulthood. Quantitative analyses are summarized in Table 2.
Figure 4
Figure 4
Associations between MWF and age for each ROI. 95% confidence limits (dashed line) and prediction limits (dot-dot-dash line) are drawn around the regression line. Plotted on the same scale, the regional differences in myelin content are apparent.
Figure 5
Figure 5
Association between Fractional Anisotropy (FA) and age for each ROI. 95% confidence limits (dashed line) and prediction limits (dot-dot-dash line) are drawn around the regression line. Note the regional differences in FA.
Figure 6
Figure 6
Association between Radial Diffusivity (RD) and age for each ROI. 95% confidence limits (dashed line) and prediction limits (dot-dot-dash line) are drawn around the regression line. Plotted on the same scale to illustrate the regional differences in RD values.
Figure 7
Figure 7
Association between Myelin Water Fraction (MWF) and Fractional Anisotropy (FA) for each ROI. 95% confidence limits (dashed line) and prediction limits (dot-dot-dash line) are drawn around the regression line.
Figure 8
Figure 8
Association between Myelin Water Fraction (MWF) and Radial Diffusivity (RD) for each ROI. 95% confidence limits (dashed line) and prediction limits (dot-dot-dash line) are drawn around the regression line.

References

    1. Aanerud J, Borghammer P, Chakravarty MM, Vang K, Rodell AB, Jonsdottir KY, et al. Brain energy metabolism and blood flow differences in healthy aging. Journal of Cerebral Blood Flow & Metabolism. 2012;32(7):1177–1187. doi: 10.1038/jcbfm.2012.18. Epub 2012 Feb 29. - DOI - PMC - PubMed
    1. Baltes PB, Nesselroade JR. History and rationale of longitudinal research. In: Nesselroade JR, Baltes PB, editors. Longitudinal research in the study of behavior and development. New York: Academic Press; 1979. pp. 1–39.
    1. Barrick TR, Charlton RA, Clark CA, Markus HS. White matter structural decline in normal ageing: a prospective longitudinal study using tract-based spatial statistics. Neuroimage. 2010;51(2):565–577. doi: 10.1016/j.neuroimage.2010.02.033. Epub 2010 Feb 21. - DOI - PubMed
    1. Bartzokis G, Beckson M, Po HLu, Nuechterlein KH, Edwards N, Mintz J. Age-related changes in frontal and temporal lobe volumes in men: A magnetic resonance imaging study. JAMA Psychiatry. 2001;58(5):461–465. - PubMed
    1. Basser PJ, Mattiello J, LeBihan D. Estimation of the effective self-diffusion tensor from the NMR spin echo. Journal of Magnetic Resonance, Series B. 1994;103:247–254. - PubMed