. 2016 Sep 13;113(37):E5379-88.
doi: 10.1073/pnas.1607231113. Epub 2016 Aug 25.

Na+ coordination at the Na2 site of the Na+/I- symporter

Affiliations

Na+ coordination at the Na2 site of the Na+/I- symporter

Giuseppe Ferrandino et al. Proc Natl Acad Sci U S A. .

Abstract

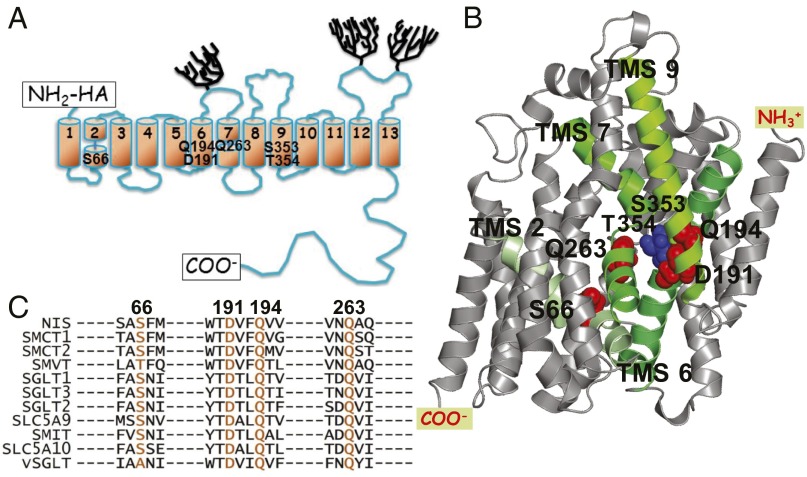
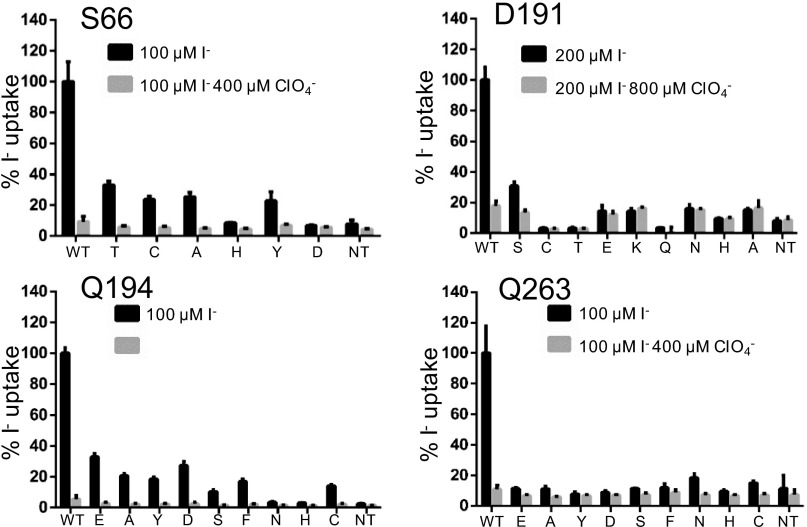
The sodium/iodide symporter (NIS) mediates active I(-) transport in the thyroid-the first step in thyroid hormone biosynthesis-with a 2 Na(+): 1 I(-) stoichiometry. The two Na(+) binding sites (Na1 and Na2) and the I(-) binding site interact allosterically: when Na(+) binds to a Na(+) site, the affinity of NIS for the other Na(+) and for I(-) increases significantly. In all Na(+)-dependent transporters with the same fold as NIS, the side chains of two residues, S353 and T354 (NIS numbering), were identified as the Na(+) ligands at Na2. To understand the cooperativity between the substrates, we investigated the coordination at the Na2 site. We determined that four other residues-S66, D191, Q194, and Q263-are also involved in Na(+) coordination at this site. Experiments in whole cells demonstrated that these four residues participate in transport by NIS: mutations at these positions result in proteins that, although expressed at the plasma membrane, transport little or no I(-) These residues are conserved throughout the entire SLC5 family, to which NIS belongs, suggesting that they serve a similar function in the other transporters. Our findings also suggest that the increase in affinity that each site displays when an ion binds to another site may result from changes in the dynamics of the transporter. These mechanistic insights deepen our understanding not only of NIS but also of other transporters, including many that, like NIS, are of great medical relevance.

Keywords: NIS; Na+ binding site; Na+-driven cotransporters; Na+/I− symporter; protein dynamics.


Conflict of interest statement

The authors declare no conflict of interest.

Figures

Fig. 1.
Fig. 1.
NIS models and SLC5 family alignment. (A) NIS secondary structure model. Numbered cylinders represent the transmembrane segments (TMSs); trees, the carbohydrates; and rectangles, the carboxy terminus and the HA tag at the amino terminus. The positions of the residues determined to be significant for Na+ coordination at the Na2 site are identified by residue name. (B) NIS 3D homology model (5). Green TMSs are those containing the residues that interact with Na+ at the Na2 site. (C) The residues named in A are highly conserved in the SLC5 family. The residues in the other members of the family that correspond to the NIS residues of interest are shown in orange. Alignment was generated using ClustalW2 (www.ebi.ac.uk/Tools/msa/clustalw2/).
Fig. S1.
Fig. S1.
Na+ coordination at the Na2 site and interactions between residues. Bipyramidal trigonal coordination of Na+ at the Na2 site is effected by the –OHs of S353 and T354 and the main chain –COs of A65, M68, and G350. The positions of S66, D191, Q194, and Q263 are shown (A). Q194 interacts with D191 and S353 (B). Q263 interacts with atoms in the main chain of V266 (C), M258 (D), and Y259 (E) in TMS7 and with S66 at the Na2 site (F). Distances (in Å) between atoms of interest are shown.
Fig. 2.
Fig. 2.
Coordination of the Na+ at the Na2 site. (A–F) The distance between the Na+ at the Na2 site and each residue shown was measured when only the Na2 site was occupied (blue), Na2 and Na1 were occupied (red), or Na2, Na1, and I were all occupied (black). The x axis represents the distance between the Na+ and the atom in the residue closest to it. The y axis represents the fraction of the 5,000 frames in which the Na+ at the Na2 site was found at the indicated distance from the indicated residue. Each Inset shows two distances between the Na+ at the Na2 site and the side-chain oxygen when the three ions were present (black line). For Q263, only one distance is shown, corresponding to the observed single peak. Each Inset also shows the position of S353. (G) Summary of the integrated frequencies and free energies of residues 0–3 Å from the Na+ at the Na2 site. (H) Summary of the integrated frequencies and free energies of residues 3–5 Å from the Na+ at the Na2 site.
Fig. 3.
Fig. 3.
Fluctuations of NIS from ENM calculations. NIS fluctuation profiles were obtained by generating random linear combinations of the first six vibrational modes. Fluctuations are shown for NIS with no substrates (black) and NIS with the Na1 (red); Na2 (blue); Na1 and Na2 (green); and Na1, Na2, and I (pink) sites occupied. Numbered rectangles represent TMSs.
Fig. 4.
Fig. 4.
NIS-mediated I uptake at steady state. cDNA constructs coding for NIS mutants with the indicated residues replaced were transfected into COS7 or HEK cells, and I uptake mediated by these mutants was measured at 20 µM I and at 140 mM Na+ for 30 min with or without the NIS-specific inhibitor ClO4. Results are expressed as % of WT NIS I uptake ± SE. Values represent averages of the results from three different experiments, each of which was carried out in triplicate. NT, nontransfected cells.
Fig. S2.
Fig. S2.
I uptake at steady state. I uptake was measured at the saturating concentrations of 100 or 200 µM I and at 140 mM Na+ for 30 min with or without the NIS-specific inhibitor ClO4. Results are expressed as % of WT NIS I uptake ± SE. Values represent averages of the results from three different experiments, each of which was carried out in triplicate.
Fig. S3.
Fig. S3.
All NIS mutants are properly targeted to the plasma membrane. Nontransfected HEK cells and HEK cells transfected with WT NIS or the indicated NIS mutants were incubated under nonpermeabilized conditions with an anti-HA antibody that recognizes the extracellular N terminus HA epitope and analyzed by flow cytometry. The x axes show the intensity of the fluorescence of each single cell; these values were arrived at using the forward or the side scatter, parameters, respectively, representing the size and the complexity of the cells and shown on the y axes. For each acquisition, NT cells were used as a reference to identify the negative cells and determine the percentage of cells expressing WT NIS or the indicated NIS mutants.
Fig. S4.
Fig. S4.
All NIS mutants are properly targeted to the plasma membrane. Nontransfected HEK cells and HEK cells transfected with WT NIS or the indicated NIS mutants [(A) S66, (B) Q194, (C) Q263] were biotinylated under nonpermeabilized conditions and immunoblotted with anti-NIS Abs (Upper) or anti-Na+/K+ ATPase Abs, as a loading control (Lower).
Fig. 5.
Fig. 5.
Kinetic analysis of Q194 E and Y and Q263N NIS and effect of varying pH. Initial rates of I uptake (2-min time points or 6-min time points for Q263N) were determined at 140 mM Na+ and varying concentrations of I (A and C) and at varying concentrations of Na+ and 50 µM I, for Q194 E and Y, or 200 µM I, for Q263N (B and D). KmI− and KmNa+ values are indicated in E. Absolute values of WT NIS I uptake in a representative experiment at higher I or Na+ concentrations were, respectively, 128 ± 10 and 90 ± 5 pmol/µg DNA. (F) I uptake at 5 min was assessed in HEK cells expressing WT or Q194 E, D, or H NIS at 40 µM I and at increasing pH values. Absolute values of WT NIS I uptake in a representative experiment at pH 6, 7.4, and 8.2 were, respectively, 132 ± 5, 180 ± 5, and 185 ± 5 pmol/µg DNA. Results are expressed as % of WT NIS I uptake ± SE. Values represent averages of the results from two or three different experiments, each of which was carried out in triplicate.
Fig. S5.
Fig. S5.
Kinetic analysis of S66T and D191S NIS. Initial rates of I uptake (2-min time points) at varying concentrations of I and 140 mM Na+ (A and C) and at varying concentrations of Na+ and a constant concentration of I (100 µM for S66T NIS and 200 µM for D191S NIS) (B and D) were determined for WT and S66T NIS (A and B) and D191S NIS (C and D) as described in Materials and Methods. Background from the values obtained from nontransfected cells was subtracted from each data point. KmI− and KmNa+ values are given in the tables. Results are expressed as pmol/µg DNA ± SD. Graphs show data from experiments carried out at least two times in triplicate.
Fig. 6.
Fig. 6.
Coordination of Na+ at the Na2 site in WT NIS and NIS mutants. (A–F) MD simulations were carried out with WT NIS or the indicated NIS mutants with the Na2, Na1, and I sites occupied. The residual activity of each NIS mutant is given in parentheses as a % of WT NIS activity. Ep and E, respectively, refer to the protonated and nonprotonated forms of glutamate. (G) Summary of the integrated frequencies and free energies of residues 0–3 Å from the Na+ at the Na2 site. (H) Summary of the integrated frequencies and free energies of residues 3–5 Å from the Na+ at the Na2 site.
Fig. 7.
Fig. 7.
Na2 network. (A) Correlation of the distances between residues whose movements are associated with coordination of the Na+ at the Na2 site. The correlation coefficients of the distances of the two residues from the Na+ at the Na2 site shown in column 1 are given in column 2. Two residues that replace each other in Na+ coordination have a negative correlation value (orange); two residues that jointly approach or move away from Na+ have a positive correlation value (light green). The average distance between each of the residues and the Na+ and the corresponding SD are shown in columns 3 and 4. Correlations between residue displacements are summarized. (B) Coordination of the Na+ at the Na2 site mediated by S353 and T354 when Na1 and Na2 are occupied. (C–E) Representative frames corresponding to the farther-away peak for T354, D191, and S66. (C) When Na1, Na2, and I are occupied, the Na+ at the Na2 site moves far away from S353 and T354, and S66 coordinates the Na+. (D) When T354 is not coordinating the Na+ at the Na2 site, D191 and S66 are close enough to the Na+ to hold it. (E) When T354 and S66 are coordinating the Na+, Q263 is too far away to be a Na+ ligand. Note the movement of the side chain of S66 (compare with C). aThe correlation coefficient C is given byC=i=1N(d1,id1¯)(d2,id2¯)i=1N(d1,id1¯)2i=1N(d2,id2¯)2.
Fig. 8.
Fig. 8.
Schematic representation of Na+ coordination at the Na2 site. (Upper) Na+ coordination at the Na2 site of WT NIS, when the Na2 (blue box); Na2 and Na1 (red box); and Na2, Na1, and I (black box) sites are occupied. (Lower) Na+ coordination at the Na2 site of NIS mutants, with all three ions bound. Blue circles show substituted amino acids. Residual activity is given in parentheses as % of WT NIS activity. Double red lines represent distances ≤2.5 Å; green lines, distances >2.6 and ≤3.9 Å; and violet lines, distances ≥4 Å. Ep and E, respectively, refer to the protonated and nonprotonated forms of glutamate.

Similar articles

Cited by

References

    1. Carrasco N. Iodide transport in the thyroid gland. Biochim Biophys Acta. 1993;1154(1):65–82. - PubMed
    1. Dai G, Levy O, Carrasco N. Cloning and characterization of the thyroid iodide transporter. Nature. 1996;379(6564):458–460. - PubMed
    1. De La Vieja A, Dohan O, Levy O, Carrasco N. Molecular analysis of the sodium/iodide symporter: Impact on thyroid and extrathyroid pathophysiology. Physiol Rev. 2000;80(3):1083–1105. - PubMed
    1. Eskandari S, et al. Thyroid Na+/I− symporter. Mechanism, stoichiometry, and specificity. J Biol Chem. 1997;272(43):27230–27238. - PubMed
    1. Paroder-Belenitsky M, et al. Mechanism of anion selectivity and stoichiometry of the Na+/I− symporter (NIS) Proc Natl Acad Sci USA. 2011;108(44):17933–17938. - PMC - PubMed

Publication types