. 2016 Oct;231(1):35-48.
doi: 10.1530/JOE-16-0229.

IL-33-driven ILC2/eosinophil axis in fat is induced by sympathetic tone and suppressed by obesity

Affiliations

IL-33-driven ILC2/eosinophil axis in fat is induced by sympathetic tone and suppressed by obesity

Xiaofeng Ding et al. J Endocrinol. 2016 Oct.

Abstract

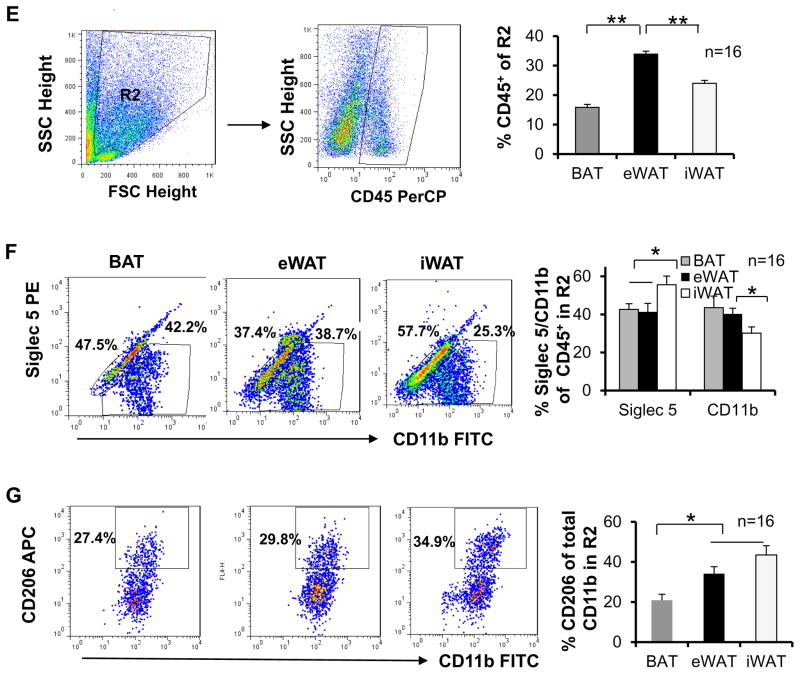
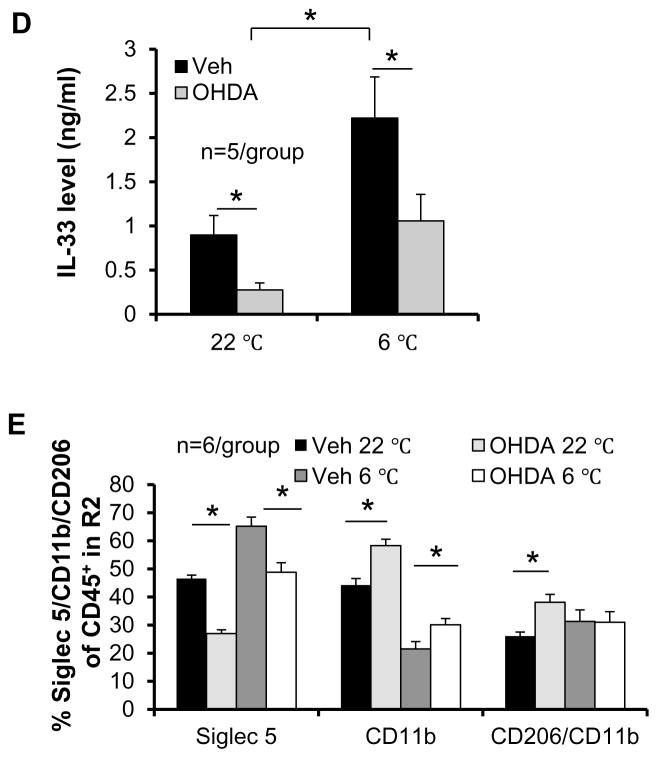
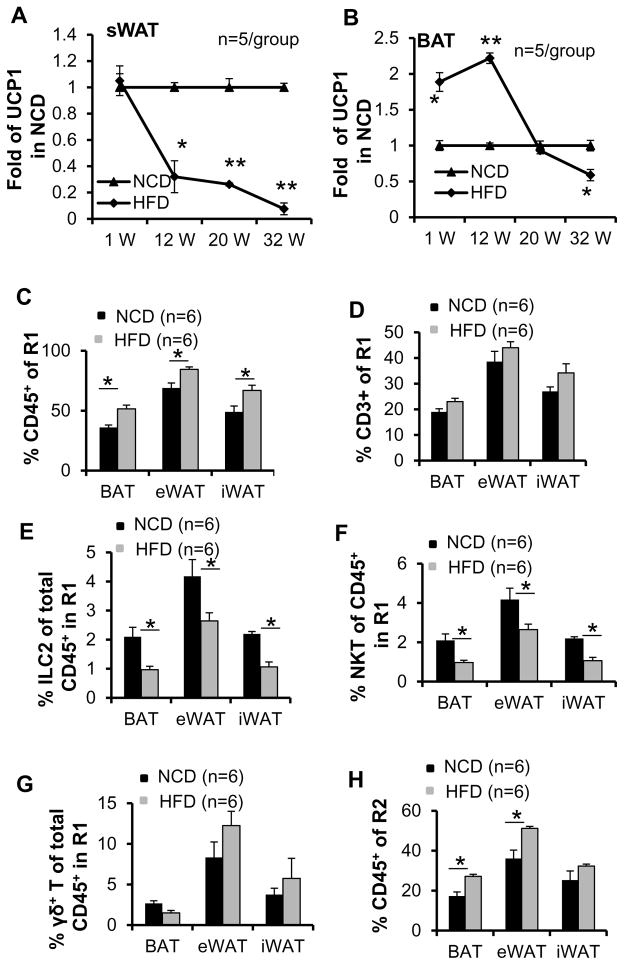
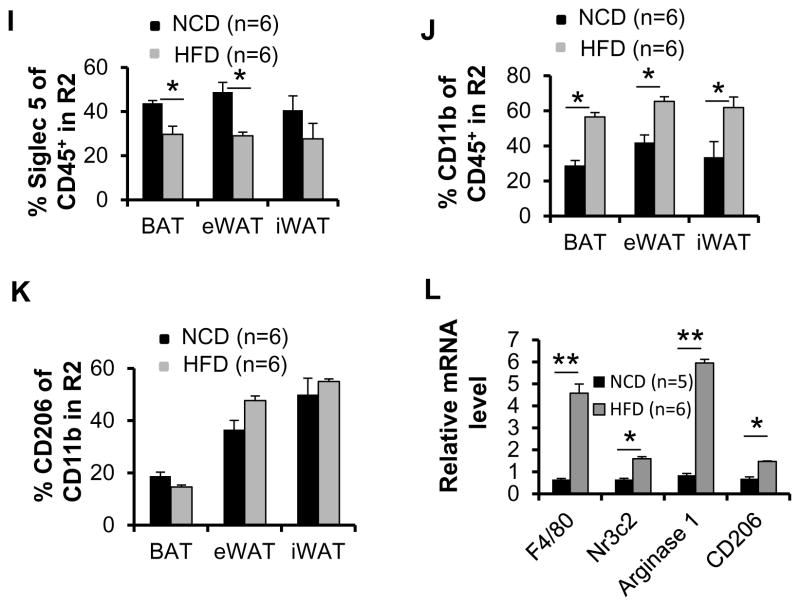
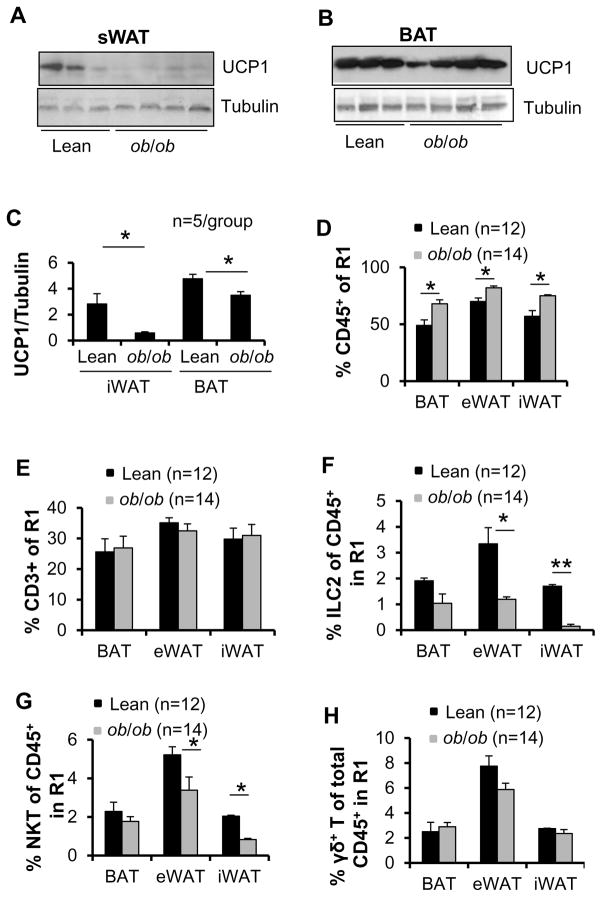
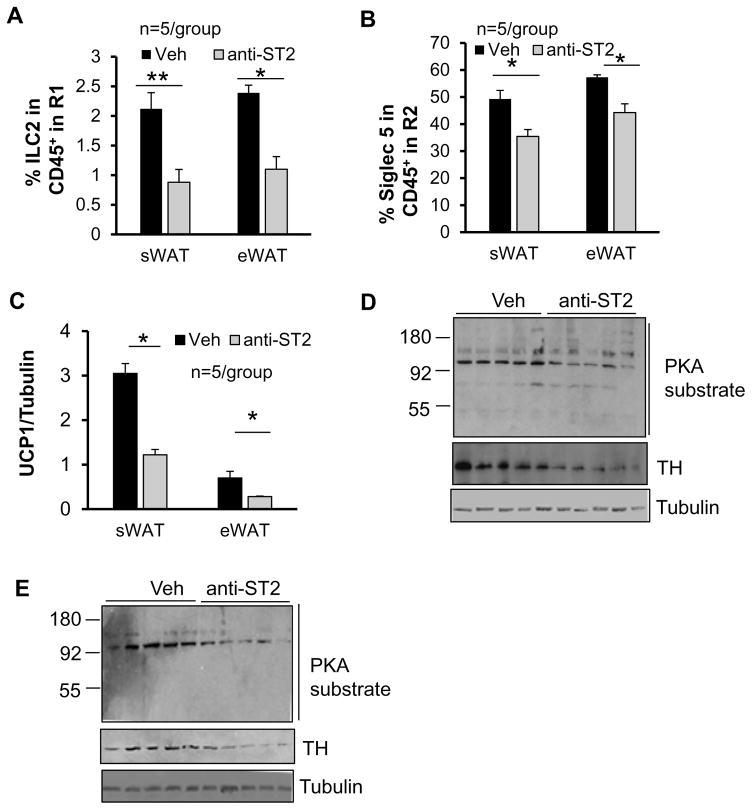
Group 2 innate lymphoid cells (ILC2s) in white adipose tissue (WAT) promote WAT browning and assist in preventing the development of obesity. However, how ILC2 in adipose tissue is regulated remains largely unknown. Here, our study shows that ILC2s are present in brown adipose tissue (BAT) as well as subcutaneous and epididymal WAT (sWAT and eWAT). The fractions of ILC2s, natural killer T (NKT) cells and eosinophils in sWAT, eWAT and BAT are significantly decreased by high-fat-diet (HFD) feeding and leptin deficiency-induced obesity. Consistent with this, the adipose expression and circulating levels of IL-33, a key inducing cytokine of ILC2, are significantly downregulated by obesity. Furthermore, administration of IL-33 markedly increases the fraction of ILC2 and eosinophil as well as the expression of UCP1 and tyrosine hydroxylase (TH), a rate-limiting enzyme in catecholamine biosynthesis, in adipose tissue of HFD-fed mice. On the other hand, cold exposure induces the expression levels of IL-33 and UCP1 and the population of ILC2 and eosinophil in sWAT, and these promoting effects of cold stress are reversed by neutralization of IL-33 signaling in vivo Moreover, the basal and cold-induced IL-33 and ILC2/eosinophil pathways are significantly suppressed by sympathetic denervation via local injection of 6-hydroxydopamine (6-OHDA) in sWAT. Taken together, our data suggest that the ILC2/eosinophil axis in adipose tissue is regulated by sympathetic nervous system and obesity in IL-33-dependent manner, and IL-33-driven ILC2/eosinophil axis is implicated in the development of obesity.

Keywords: IL-33; ILC2; eosinophil; obesity; sympathetic tone.


Conflict of interest statement

Declaration of interest The authors declare that there is no conflict of interest that could be perceived as prejudicing the impartiality of this review.

Figures

Fig. 1
Fig. 1. Differential abundance of innate/innate-like lymphocytes, eosinophils and monocytes in three types of fat
The stromal vascular fraction (SVF) from 10-week-old male C57BL/6 mice (n=16) was isolated, suspended, fixed, blocked, surface-stained, permeabilized, and labeled by incubation with conjugate antibodies. The labeled cells were selected by size and granularity, and then gated by cell-surface markers using flow cytometry. A. Definition of gate R1 (SSClowFSClow) cells, representative FACS plots and percentage of FSClowCD45+ and SSClowCD3+ cells in gate R1 in brown, epididymal and inguinal fat pads. The dot plots depict SSC and FSC and the sequential gating strategy for analysis of CD45+ and CD3+ cells are presented. B. Representative FACS plots of LinIL-13+ ILC2s in gate R1 and percentage of ILC2s in CD45+ cells from gate R1 in three fat pads. C. Representative FACS plots of CD1d+CD3+ NKT cells in gate R1 and percentage of NKT cells in CD45+ cells from gate R1 in three fat pads. D. Representative FACS plots of γδ T+CD3+ cells in gate R1 and percentage of γδ T cells in CD45+ cells from gate R1 in three fat pads. E. Definition of gate R2 (SSChighFSChigh) cells, representative FACS plots and percentage of CD45+ cells in gate R2 in three fat pads. F. Representative dot plots and percentage of Siglec-5+CD11b+ and Siglec-5CD11b+ macrophages in CD45+ cells from gate R2. G. Representative dot plots and percentage of Siglec-5CD11b+CD206+ to Siglec 5CD11b+ macrophages from gate R2 in three fat pads. The data were presented as the mean ± SEM. *p<0.05, **p<0.01.
Fig. 2
Fig. 2. ILC2/eosinophil axis was suppressed by denervation in inguinal fat
Inguinal fat pad in 7-week-old male C57BL/6 mice (n=6) was locally injected with vehicle or 6-OHDA. Two weeks post injection, the mice were exposed with or without cold for 48 hours, and inguinal fat pads were collected for Western blot, ELISA and flow cytometry analysis. A. The basal and cold-induced levels of norepinephrine in inguinal fat were significantly decreased by denervation. Inguinal fat pad was weighed, homogenized, and used for the ELISA of norepinephrine. B. The basal and cold-induced expression levels of UCP1 were greatly downregulated by denervation in inguinal fat. Tubulin was used as internal control. The data were quantified and analyzed with t-test. C. The fractions of LinIL-13+ ILC2s but not CD1d+CD3+ NKT cells and γδ T cells under basal and cold conditions were decreased by denervation in inguinal fat. SVF from denervated or control inguinal fat was isolated and used for flow cytometry analysis. D. The basal and cold-induced levels of IL-33 in inguinal fat were significantly decreased by denervation. Inguinal fat pads were homogenized and used for measurement of protein concentration and ELISA of IL-33. E. Cold stress increased the percentage of Siglec-5+CD11b+ eosinophils and decreased Siglec-5CD11b+ macrophage population, while denervation decreased the abundance of Siglec-5+CD11b+ eosinophils and slightly increased Siglec 5CD11b+ macrophage population and percentage of Siglec-5CD11b+CD206+ (M2) to Siglec 5CD11b+ macrophages. All data were presented as the mean ± SEM. *p<0.05.
Fig. 3
Fig. 3. The abundance of ILC2s, eosinophils and NKT cells in SVF of adipose tissue was decreased by HFD feeding
6-week-old C57BL/6 mice (n=6) were fed with a normal chow diet (NCD) or high fat diet (HFD) for 1, 12, 20 or 32 weeks. Western blot analysis was used to determine the expression levels of UCP1 in inguinal and brown fat in mice fed with NCD and HFD for 1, 12, 20 or 32 weeks. Tubulin was used as the loading control. The brown, inguinal and epididymal fat pads collected from mice fed with NCD or HFD for 12 weeks were used for flow cytometry analysis. The fold change of UCP1 expression of HFD feeding to NCD group in sWAT (A) and BAT (B) were quantified and analyzed. The percentage of FSClowCD45+ cells (C) but not SSClowCD3+ cells (D) in gate R1 in three fat pads was significantly increased in HFD-fed mice compared to NCD-fed mice. The percentage of ILC2s (E) and NKT cells (F), but not γδ T (G) in CD45+ cells from gate R1 in three fat pads was significantly decreased by HFD feeding. H. The percentage of FSClowCD45+ cells in gate R2 in three fat pads was significantly increased in HFD-fed mice compared to NCD-fed mice. I. The fraction of Siglec 5+CD11b+ eosinophils was decreased by HFD feeding. The population of Siglec 5CD11b+ macrophage (J) but not Siglec-5CD11b+CD206+ (M2) to Siglec-5CD11b+ macrophage (K) was increased by HFD feeding. L. The mRNA levels of macrophage marker F4/80, M1 marker Nr3c2, and M2 markers Arginase and CD206 are induced by 12 weeks of HFD feeding. The data were presented as the mean ± SEM. *p<0.05, **p<0.01.
Fig. 4
Fig. 4. The fractions of NKT and ILC2s in SVF were decreased in brown, epididymal and inguinal fat in ob/ob mice
Brown, inguinal and epididymal fat pads were collected from 9-week-old lean (n=12) and ob/ob (n=14) mice, and SVF from fat was isolated and used for flow cytometry analysis. The expression levels of UCP1 in inguinal (A) and brown (B) fat were downregulated in ob/ob mice compared to lean mice. Tubulin was used as the loading control. C. The data in Figs. A and B were quantified and analyzed. The percentage of FSClowCD45+ cells (D) but not SSClowCD3+ cells (E) in gate R1 in three fat pads was significantly increased in ob/ob mice compared to lean mice. The percentage of ILC2s (F) and NKT cells (G), but not γδ T (H) in CD45+ cells from gate R1 in three fat pads was significantly decreased by leptin deficiency. I. The percentage of SSChighFSChighCD45+ cells in gate R2 in three fat pads was significantly increased in ob/ob mice compared to lean mice. J. The fraction of Siglec 5+CD11b+ eosinophils was decreased by leptin deficiency. The population of Siglec 5CD11b+ macrophage (K) but not Siglec-5CD11b+CD206+ (M2) to Siglec-5CD11b+ macrophage (L) was increased by leptin deficiency. The data were presented as the mean ± SEM. *p<0.05, **p<0.01.
Fig. 5
Fig. 5. IL-33 treatment restored the fraction of ILC2/eosinophil pathway and UCP1 expression in WAT of HFD-fed mice
(A) The mRNA levels of IL-33 in inguinal fat were induced by cold exposure but suppressed by HFD feeding and leptin deficiency. The circulating levels (B) and protein level (C) in sWAT of IL-33 were significantly increased by cold stress, while decreased by HFD feeding and leptin deficiency. The level of IL-33 was measured with ELISA analysis. The percentages of ILC2s and eosinophils in CD45+ cells from gate R1 and gate R2 respectively in sWAT (D) and in eWAT (E) were significantly increased by IL-33 injection. (F) The protein levels of UCP1 in sWAT and eWAT were upregulated by IL-33 administration in HFD-fed mice. The expression levels of TH and phosphorylation of PKA substrates in sWAT (G) and in eWAT (H) were upregulated by IL-33 administration in HFD-fed mice. Tubulin was used as the loading control. The data in Fig. 5A–5F were presented as the mean ± SEM. *p<0.05, **p<0.01.
Fig. 6
Fig. 6. Administration of ST2 antibody downregulated ILC2/eosinophil pathway and expression levels of TH and UCP1 in WAT
The percentages of ILC2s (A) and eosinophils (B) in CD45+ cells from gate R1 and gate R2 respectively in sWAT and eWAT were significantly decreased by ST2 antibody injection. (C) The protein levels of UCP1 in sWAT and eWAT were downregulated by ST2 antibody administration. The expression levels of TH and phosphorylation of PKA substrates in sWAT (D) and in eWAT (E) were downregulated by ST2 antibody administration. Tubulin was used as the loading control. The data in Figs. 6A–6B were presented as the mean ± SEM. *p<0.05, **p<0.01.

Similar articles

Cited by

References

    1. Akbari O, Stock P, Meyer E, Kronenberg M, Sidobre S, Nakayama T, Taniguchi M, Grusby MJ, DeKruyff RH, Umetsu DT. Essential role of NKT cells producing IL-4 and IL-13 in the development of allergen-induced airway hyperreactivity. Nat Med. 2003;9:582–588. - PubMed
    1. Barbatelli G, Murano I, Madsen L, Hao Q, Jimenez M, Kristiansen K, Giacobino JP, De Matteis R, Cinti S. The emergence of cold-induced brown adipocytes in mouse white fat depots is determined predominantly by white to brown adipocyte transdifferentiation. Am J Physiol Endocrinol Metab. 2010;298:E1244–1253. - PubMed
    1. Bostrom P, Wu J, Jedrychowski MP, Korde A, Ye L, Lo JC, Rasbach KA, Bostrom EA, Choi JH, Long JZ, et al. A PGC1-alpha-dependent myokine that drives brown-fat-like development of white fat and thermogenesis. Nature. 2012;481:463–468. - PMC - PubMed
    1. Brestoff JR, Kim BS, Saenz SA, Stine RR, Monticelli LA, Sonnenberg GF, Thome JJ, Farber DL, Lutfy K, Seale P, et al. Group 2 innate lymphoid cells promote beiging of white adipose tissue and limit obesity. Nature. 2014;519:242–246. - PMC - PubMed
    1. Cao W, Daniel KW, Robidoux J, Puigserver P, Medvedev AV, Bai X, Floering LM, Spiegelman BM, Collins S. p38 mitogen-activated protein kinase is the central regulator of cyclic AMP-dependent transcription of the brown fat uncoupling protein 1 gene. Mol Cell Biol. 2004;24:3057–3067. - PMC - PubMed

Publication types