. 2017 May;37(5):1748-1762.
doi: 10.1177/0271678X16659496. Epub 2016 Jan 1.

Heterogeneous incidence and propagation of spreading depolarizations

Affiliations

Heterogeneous incidence and propagation of spreading depolarizations

Dan Kaufmann et al. J Cereb Blood Flow Metab. 2017 May.

Abstract

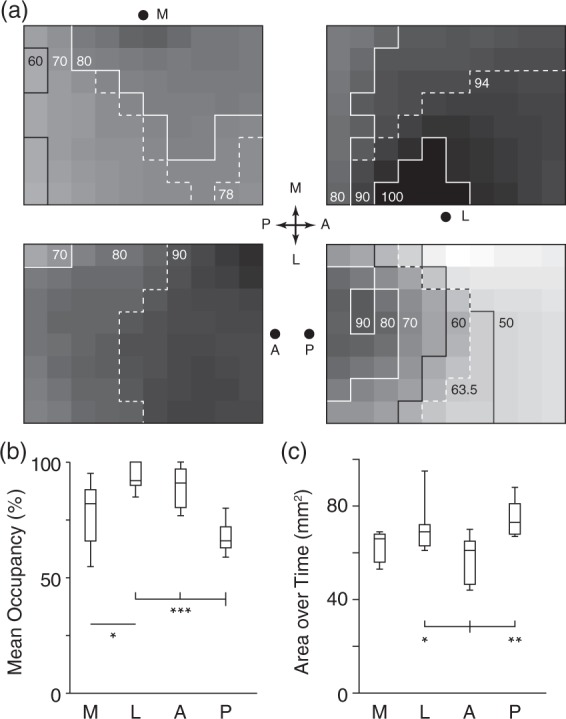
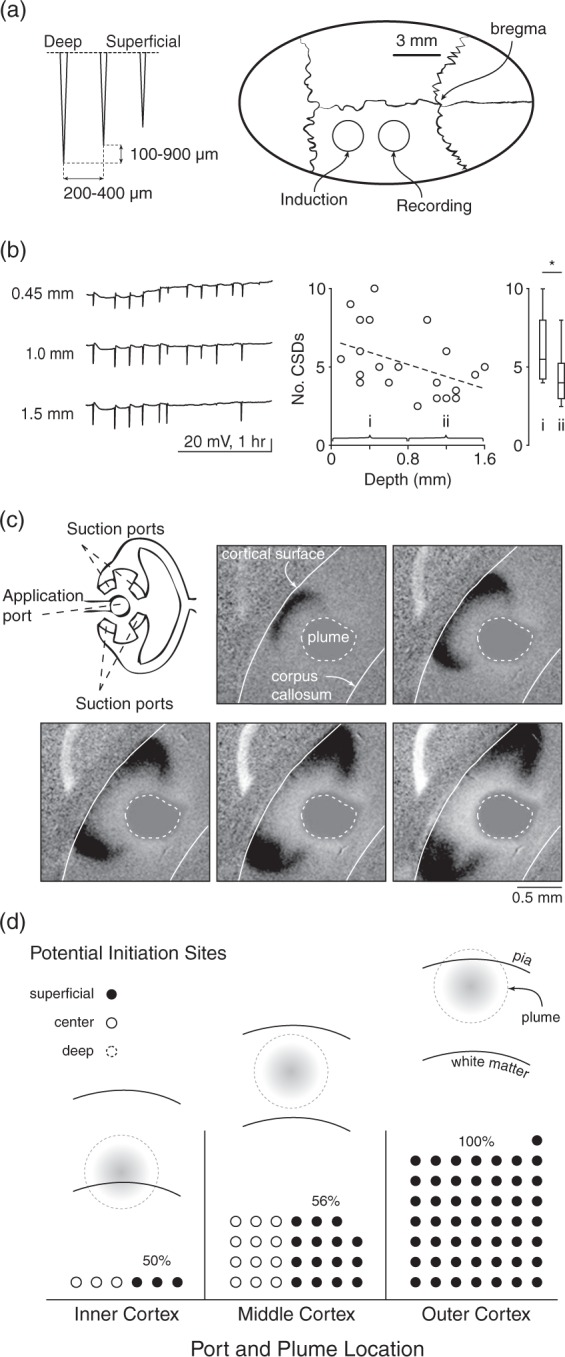
Spreading depolarizations are implicated in a diverse set of neurologic diseases. They are unusual forms of nervous system activity in that they propagate very slowly and approximately concentrically, apparently not respecting the anatomic, synaptic, functional, or vascular architecture of the brain. However, there is evidence that spreading depolarizations are not truly concentric, isotropic, or homogeneous, either in space or in time. Here we present evidence from KCl-induced spreading depolarizations, in mouse and rat, in vivo and in vitro, showing the great variability that these depolarizations can exhibit. This variability can help inform the mechanistic understanding of spreading depolarizations, and it has implications for their phenomenology in neurologic disease.

Keywords: Spreading depolarization; anisotropy; cortical spreading depression; susceptibility; velocity.


Figures

Figure 1.
Figure 1.
Susceptibility and hemodynamic characteristics of SD vary by induction site. (a) Schematic shows SD induction sites (black circles) superimposed over the mouse brain with labeled cytoarchitecture. Induction sites: medial: retrosplenial cortex; lateral: auditory cortex; anterior: forepaw somatosensory cortex; posterior: primary visual cortex. Rectangle shows boundaries of thin skull region; white circle shows location of spectroscopy probe. (b) Box whisker plots show total, full, and partial SD counts originating from the four induction sites, measured from an equal-sized region of interest to allow comparisons between the four locations. There is a significant difference in total, full and partial SD, driven by large differences in the posterior (visual cortex) induction site (ANOVA followed by a Tukey multiple comparison test, *p < 0.05, **p < 0.01, ***p < 0.001, n(animals) = 9, 8, 9, 7, for the medial, lateral, anterior and posterior sites respectively). (c) Inter-event intervals for medial, lateral, posterior, and anterior induction sites. (ANOVA followed by a Tukey multiple comparison test, *p < 0.05, **p < 0.01, ***p < 0.001, n = 9, 7, 9, 7, for the medial, lateral, anterior, and posterior sites respectively). (d) Left trace shows equal and opposite changes in total hemoglobin (HbT) and optical intrinsic signal (OIS) during SD, showing that OIS can be used to infer blood volume changes. Right trace shows typical SD OIS profile. Amplitude of hemodynamic changes was measured from peak (hypoperfusion) to trough (hyperperfusion) of SD-associated reflectance change. Left graph. Normalized change in perfusion between the different induction sites. (Data were normalized by dividing the change in perfusion for each induction site by the average change in perfusion for all sites). The posterior induction site had a higher normalized change in perfusion compared to the other induction sites. Right graph. Duration of perfusion between the different induction sites. The posterior site had a significantly reduced duration compared to the anterior and medial sites but not the lateral site. The lateral induction site had a significantly decreased duration of perfusion compared to the medial induction site (ANOVA followed by a Tukey multiple comparison test, *p < 0.05, **p < 0.01, ***p < 0.001, n = 6, 5, 7, and 4 for the medial, lateral anterior and posterior sites respectively). (e) Schematic shows typical hemoglobin saturation trace during multiple SDs. Hemoglobin desaturation amplitude (left graph) and half width (right graph). Hemoglobin desaturation was significantly smaller in posterior compared to anterior and lateral induction sites, despite being the closest site to the spectroscopy probe. No difference between the different induction sites was seen in half width duration (ANOVA followed by a Tukey multiple comparison test, *p < 0.05, ***p < 0.001, n = 4, 8, 4, 5, for the medial, lateral, anterior and posterior sites respectively).
Figure 2.
Figure 2.
Velocity and hemodynamic amplitude are larger for first vs. subsequent SD. (a) SD velocity, though not significantly different between cortical induction sites (data not shown), shows significant decreases (as well as decreases in variability) when comparing first to all subsequent SD. (b) Left graph: Amplitude of SD-associated blood volume change is larger in first compared to subsequent SD. Right graph: There was no significant difference in duration of blood volume changes (*** p < 0.001, *p < 0.05, Student’s t-test, n = 20 mice). (c) Inter-event intervals from all four induction sites divided into four types of transitions: full to full, full to partial, partial to full, partial to partial. Full–full transitions had the longest intervals; partial–partial the shortest, with intermediate values for full–partial and partial–full transitions (*p < 0.05, **p < 0.01, ***p < 0.001, Tukey multiple comparison test, n = 91, 79, 74, and 28 for the “full–full,” “full–partial,” “partial–full,” and “partial–partial” groups, respectively).
Figure 3.
Figure 3.
SD propagation patterns for all experiments. Each square represents a SD propagation pattern. Total number of incidences is given above each pattern. Patterns without a number occurred less than 5 times.
Figure 4.
Figure 4.
Heterogeneous SD patterns. All contours are plotted at 4-s intervals. All scale bars are 1 mm. (a) All 8 SD from a medial induction experiment. Last panel is superimposed over a standard deviation map of the experiment, which shows veins as dark, arteries as bright (because they change shape during SD) and cortex as intermediate gray. SD propagation varies considerably between each event. Note that first SD propagates significantly faster than all subsequent events (also seen in (b), (d), and (f)). (b) Alternating full and partial SD in a posterior induction experiment. Possible modulation of wave shape by cortical vein (first, third, and fourth panels; also see (c), second and third panels of (d) and (g)). (c) Eccentric propagation that avoids prior locations, avoids retrosplenial cortex (see also (d)). (d) Increasing avoidance of retrosplenial cortex. Possible vascular modulation of wavefront. (e) Partial SD followed by spiral SD that circles the location of prior partial (see also (c)). (f) Heterogeneous SD propagation in rat. (g) Varying propagation rate, possibly modulated by midline vein. Map at right plots derived SD velocity over each pixel, highlighting heterogeneity (methods in Chang et al.).
Figure 5.
Figure 5.
Cumulative SD propagation characteristics. (a) Panels summarize all experiments for each induction location. Each panel is an 8 × 10 grid rendering of the imaged region. Each square shows percentage occupancy by SD over all experiments for that induction location. For example, a square showing 50% occupancy was occupied by 50% of all SD waves induced. Dashed contour shows median occupancy value, giving a measure of central tendency. Each induction location has very different occupancy patterns. Also note that for all but posterior induction, there is a relative avoidance of the posteromedial (top left) squares, corresponding to retrosplenial cortex. (b) Mean percent occupancy for the four induction sites. Lowest percent occupancy was for the posterior site (primary visual cortex), highest was for lateral site (auditory cortex), corresponding with the highest and lowest proportion of partial SD, respectively. (c) Cumulative area exposed to SD over all experiments. Despite the large number of partial events, the high number of SD induced from the posterior site led to the largest area exposed.
Figure 6.
Figure 6.
SD susceptibility and propagation vary by cortical depth. (a) Schematic shows depth electrode arrays and location of electrode and KCl stimulus placement in rat. (b) Example SD traces at 450, 1000, and 1500 µm below the cortical surface (all >3 mm away from stimulus) showing decreased incidence of SD at depth. Plot at right shows lower SD incidence by depth. Box plots show number of SD/hour at 1–800 µm and 800–1600 µm depth (p = 0.04, Student’s t-test); scatter plot shows all measurements. (Spearman’s rank order correlation R = −0.45, p = 0.02, n = 22 measurements in nine animals, five with triple electrode arrays, four with double electrode arrays). (c) Schematic shows microfluidic device with application and suction ports that allow delivery of a precisely sized plume of KCl to a mouse brain slice. Images show SD induction and propagation in the superficial and middle but not deep layers, to a plume centered between pia and white matter. (d) Preferential induction of SD in superficial layers. Location of plume was either in inner, middle, or outer third of cortex (schematics). SD could theoretically start in either inner, middle, or outer third of cortex for each experimental paradigm (dotted circle, solid circle, filled circle, respectively – each circle represents a single experiment). For plumes located in inner cortex, there was no induction in the inner layers; 50% of inductions were in middle (solid circle) and 50% were in outer cortex (filled circle). For plumes located in middle cortex, 56% were in outer cortex (the remainder were in middle cortex). For plumes located in outer cortex, 100% of SD were induced in outer cortex.

References

    1. Pietrobon D, Moskowitz MA. Chaos and commotion in the wake of cortical spreading depression and spreading depolarizations. Nat Rev Neurosci 2014; 15: 379–393. - PubMed
    1. Dreier JP. The role of spreading depression, spreading depolarization and spreading ischemia in neurological disease. Nat Med 2011; 17: 439–447. - PubMed
    1. Ayata C, Lauritzen M. Spreading depression, spreading depolarizations, and the cerebral vasculature. Physiol Rev 2015; 95: 953–993. - PMC - PubMed
    1. Lauritzen M, Dreier JP, Fabricius M, et al. Clinical relevance of cortical spreading depression in neurological disorders: migraine, malignant stroke, subarachnoid and intracranial hemorrhage, and traumatic brain injury. J Cereb Blood Flow Metab 2011; 31: 17–35. - PMC - PubMed
    1. Charles B. Cortical spreading depression-new insights and persistent questions. Cephalalgia 2009; 29: 1115–1124. - PMC - PubMed

Substances