

QM/MM free energy simulations: recent progress and challenges
- PMID: 27563170
- PMCID: PMC4993472
- DOI: 10.1080/08927022.2015.1132317
QM/MM free energy simulations: recent progress and challenges
Abstract
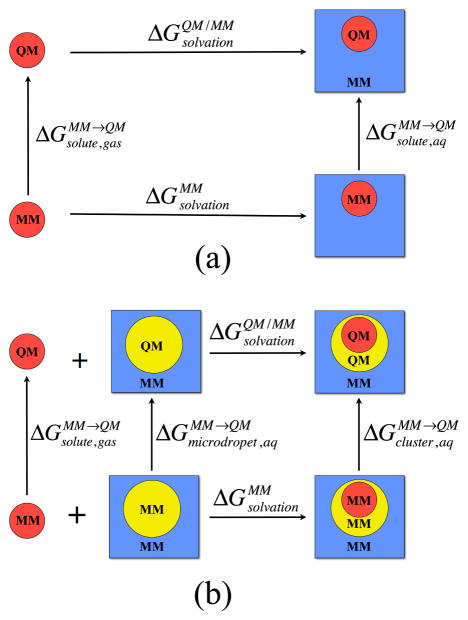
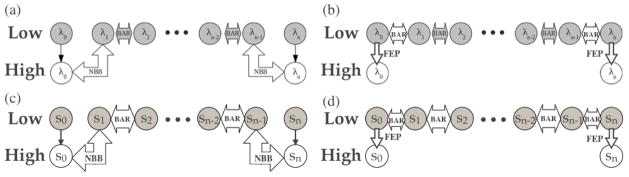
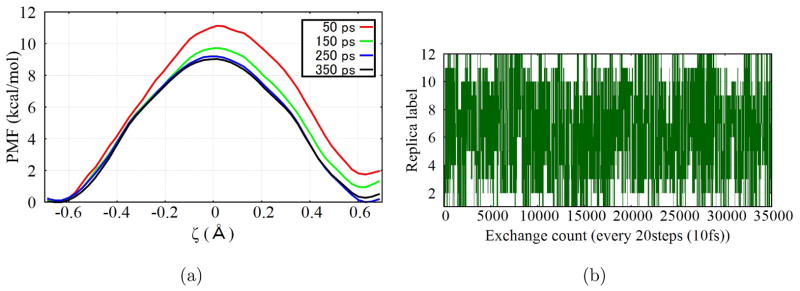
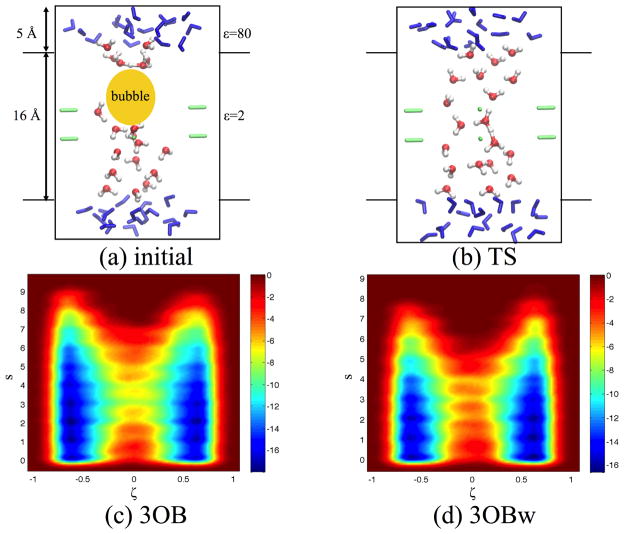
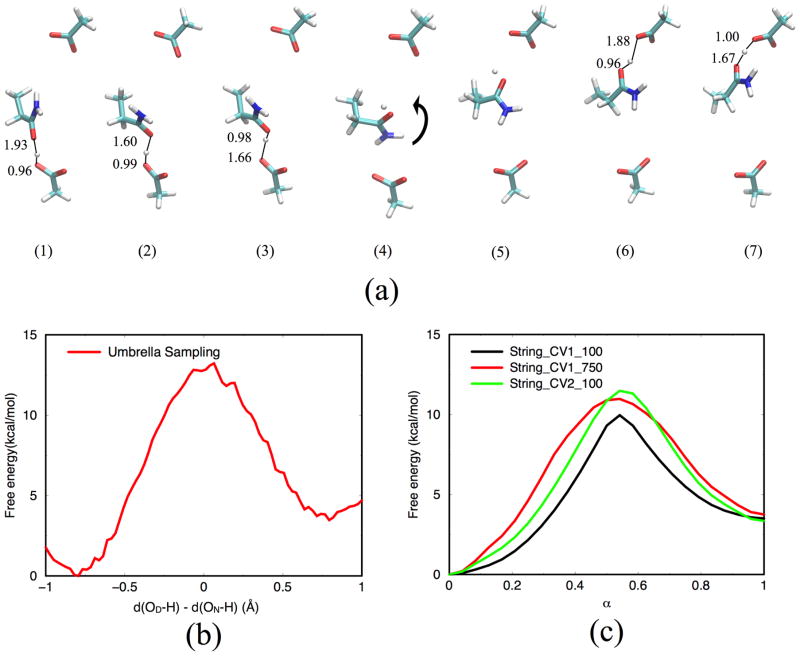
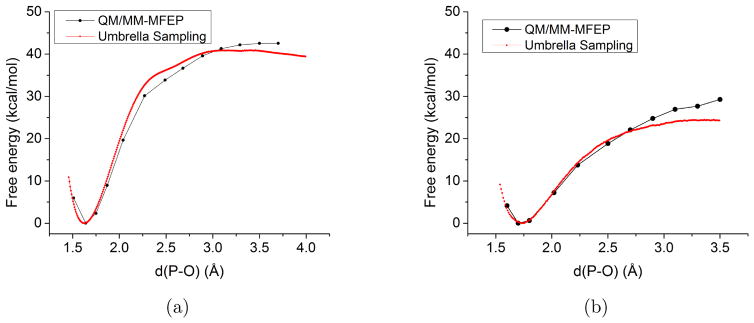
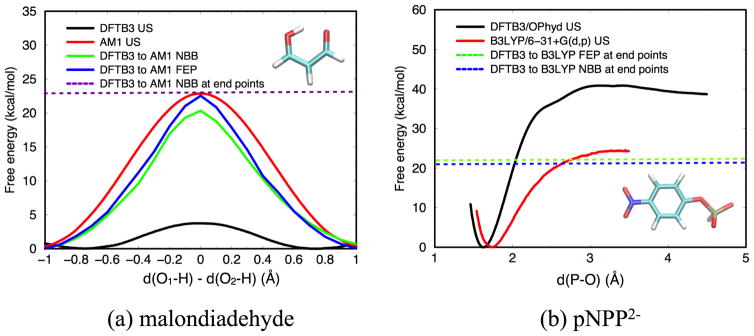
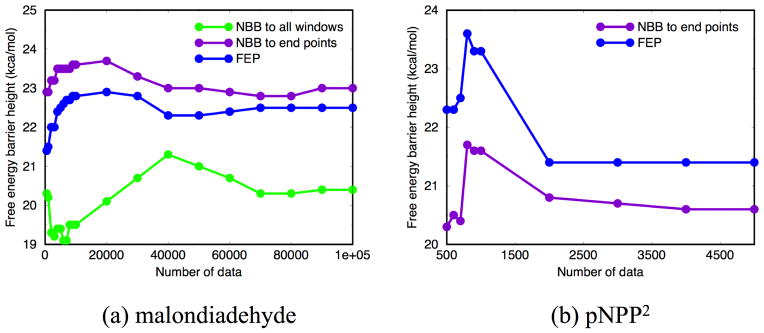
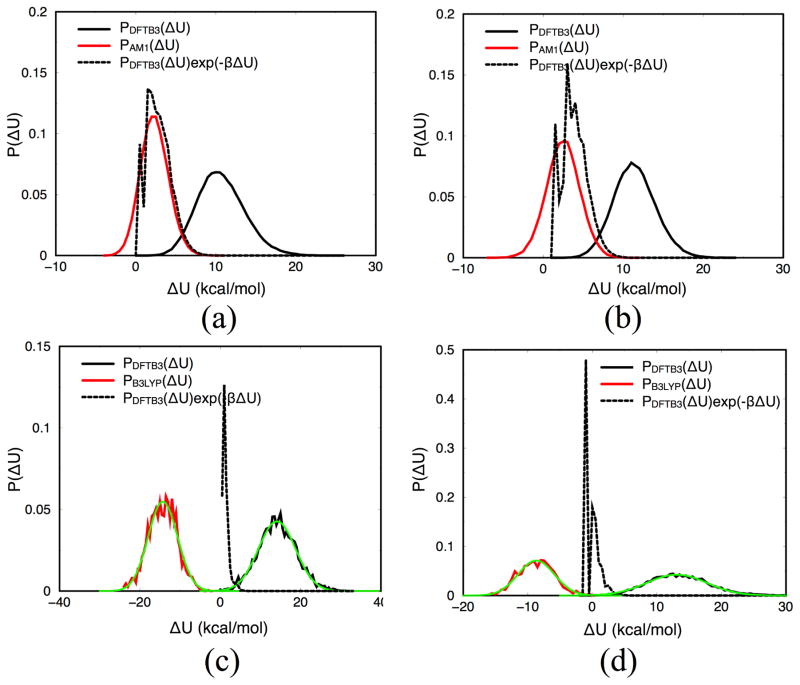
Due to the higher computational cost relative to pure molecular mechanical (MM) simulations, hybrid quantum mechanical/molecular mechanical (QM/MM) free energy simulations particularly require a careful consideration of balancing computational cost and accuracy. Here we review several recent developments in free energy methods most relevant to QM/MM simulations and discuss several topics motivated by these developments using simple but informative examples that involve processes in water. For chemical reactions, we highlight the value of invoking enhanced sampling technique (e.g., replica-exchange) in umbrella sampling calculations and the value of including collective environmental variables (e.g., hydration level) in metadynamics simulations; we also illustrate the sensitivity of string calculations, especially free energy along the path, to various parameters in the computation. Alchemical free energy simulations with a specific thermodynamic cycle are used to probe the effect of including the first solvation shell into the QM region when computing solvation free energies. For cases where high-level QM/MM potential functions are needed, we analyze two different approaches: the QM/MM-MFEP method of Yang and co-workers and perturbative correction to low-level QM/MM free energy results. For the examples analyzed here, both approaches seem productive although care needs to be exercised when analyzing the perturbative corrections.
Figures
Similar articles
-
Quantum mechanics/molecular mechanics minimum free-energy path for accurate reaction energetics in solution and enzymes: sequential sampling and optimization on the potential of mean force surface.J Chem Phys. 2008 Jan 21;128(3):034105. doi: 10.1063/1.2816557. J Chem Phys. 2008. PMID: 18205486
-
Relative Free Energies for Hydration of Monovalent Ions from QM and QM/MM Simulations.J Chem Theory Comput. 2013 Sep 10;9(9):4165-75. doi: 10.1021/ct400296w. Epub 2013 Aug 26. J Chem Theory Comput. 2013. PMID: 26592407
-
Multiscale Free Energy Simulations: An Efficient Method for Connecting Classical MD Simulations to QM or QM/MM Free Energies Using Non-Boltzmann Bennett Reweighting Schemes.J Chem Theory Comput. 2014 Apr 8;10(4):1406-1419. doi: 10.1021/ct401118k. Epub 2014 Feb 11. J Chem Theory Comput. 2014. PMID: 24803863 Free PMC article.
-
Taming Rugged Free Energy Landscapes Using an Average Force.Acc Chem Res. 2019 Nov 19;52(11):3254-3264. doi: 10.1021/acs.accounts.9b00473. Epub 2019 Nov 4. Acc Chem Res. 2019. PMID: 31680510 Review.
-
Recent advances in QM/MM free energy calculations using reference potentials.Biochim Biophys Acta. 2015 May;1850(5):954-965. doi: 10.1016/j.bbagen.2014.07.008. Epub 2014 Jul 16. Biochim Biophys Acta. 2015. PMID: 25038480 Free PMC article. Review.
Cited by
-
Computational investigations of selected enzymes from two iron and α-ketoglutarate-dependent families.Phys Chem Chem Phys. 2021 Oct 13;23(39):22227-22240. doi: 10.1039/d1cp03800a. Phys Chem Chem Phys. 2021. PMID: 34586107 Free PMC article. Review.
-
Internal force corrections with machine learning for quantum mechanics/molecular mechanics simulations.J Chem Phys. 2017 Oct 28;147(16):161732. doi: 10.1063/1.5006882. J Chem Phys. 2017. PMID: 29096448 Free PMC article.
-
Multiscale Quantum Mechanics/Molecular Mechanics Simulations with Neural Networks.J Chem Theory Comput. 2016 Oct 11;12(10):4934-4946. doi: 10.1021/acs.jctc.6b00663. Epub 2016 Sep 6. J Chem Theory Comput. 2016. PMID: 27552235 Free PMC article.
-
In Silico Studies of Small Molecule Interactions with Enzymes Reveal Aspects of Catalytic Function.Catalysts. 2017;7(7):212. doi: 10.3390/catal7070212. Epub 2017 Jul 14. Catalysts. 2017. PMID: 30464857 Free PMC article.
-
Reaction Path-Force Matching in Collective Variables: Determining Ab Initio QM/MM Free Energy Profiles by Fitting Mean Force.J Chem Theory Comput. 2021 Aug 10;17(8):4961-4980. doi: 10.1021/acs.jctc.1c00245. Epub 2021 Jul 20. J Chem Theory Comput. 2021. PMID: 34283604 Free PMC article.
References
-
- Pauling L. The Nature of the Chemical Bond and the Structure of Molecules and Crystals: An Introduction to Modern Structural Chemistry. 3. Cornell University Press; Ithaca: 1960.
-
- McCammon JA, Gelin BR, Karplus M. Dynamics of Folded Proteins. Nature. 1977;267:585–590. - PubMed
-
- Warshel A, Levitt M. Theoretical Studies of Enzymic Reactions - Dielectric, Electrostatic and Steric Stabilization of Carbonium-Ion in Reaction of Lysozyme. J Mol Biol. 1976;103:227–249. - PubMed
-
- Field MJ, Bash PA, Karplus M. A Combined Quantum-Mechanical and Molecular Mechanical Potential for Molecular-Dynamics Simulations. J Comput Chem. 1990;11:700–733.
-
- Lipkowitz KB, Boyd DB, editors. J. Gao, In Reviews in Computational Chemistry VII. VCH; New York: 1995. p. 119.
Grants and funding
LinkOut - more resources
Full Text Sources
Other Literature Sources