

Spatio-Temporal Distribution of Mycobacterium tuberculosis Complex Strains in Ghana
- PMID: 27564240
- PMCID: PMC5001706
- DOI: 10.1371/journal.pone.0161892
Spatio-Temporal Distribution of Mycobacterium tuberculosis Complex Strains in Ghana
Abstract
Background: There is a perception that genomic differences in the species/lineages of the nine species making the Mycobacterium tuberculosis complex (MTBC) may affect the efficacy of distinct control tools in certain geographical areas. We therefore analyzed the prevalence and spatial distribution of MTBC species and lineages among isolates from pulmonary TB cases over an 8-year period, 2007-2014.
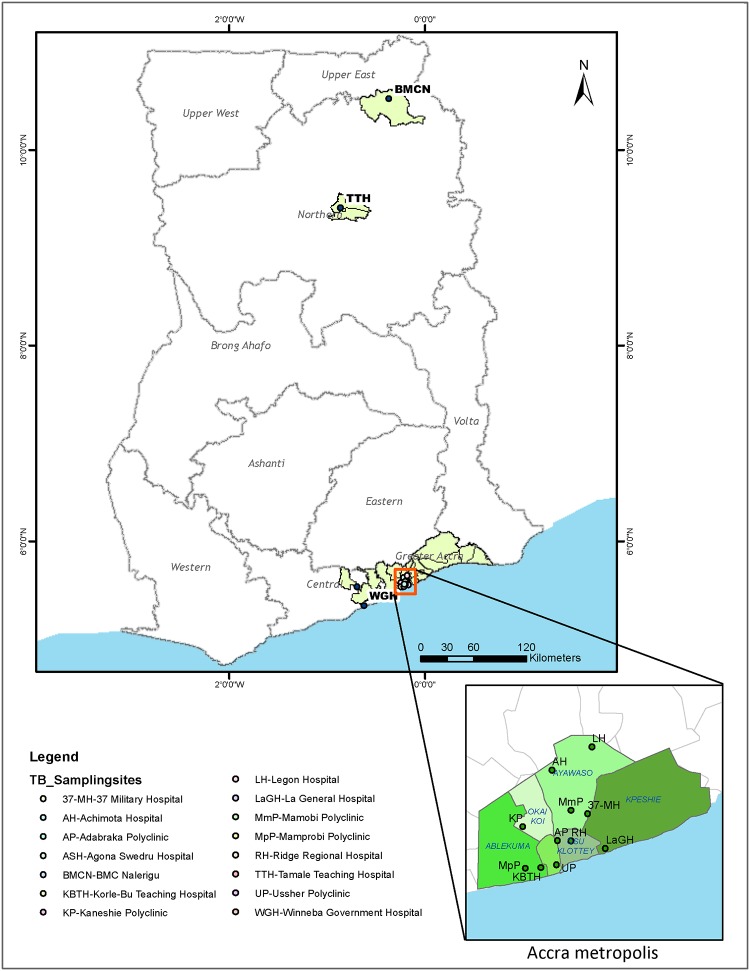
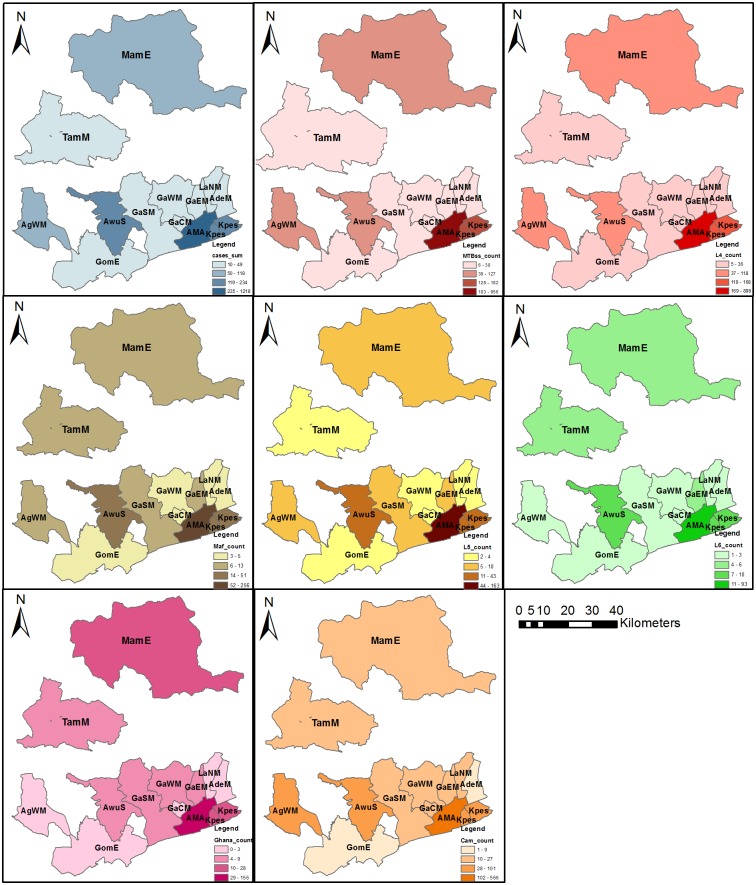
Methodology: Mycobacterial species isolated by culture from consecutively recruited pulmonary tuberculosis patients presenting at selected district/sub-district health facilities were confirmed as MTBC by IS6110 and rpoß PCR and further assigned lineages and sub lineages by spoligotyping and large sequence polymorphism PCR (RDs 4, 9, 12, 702, 711) assays. Patient characteristics, residency, and risks were obtained with a structured questionnaire. We used SaTScan and ArcMap analyses to identify significantly clustered MTBC lineages within selected districts and spatial display, respectively.
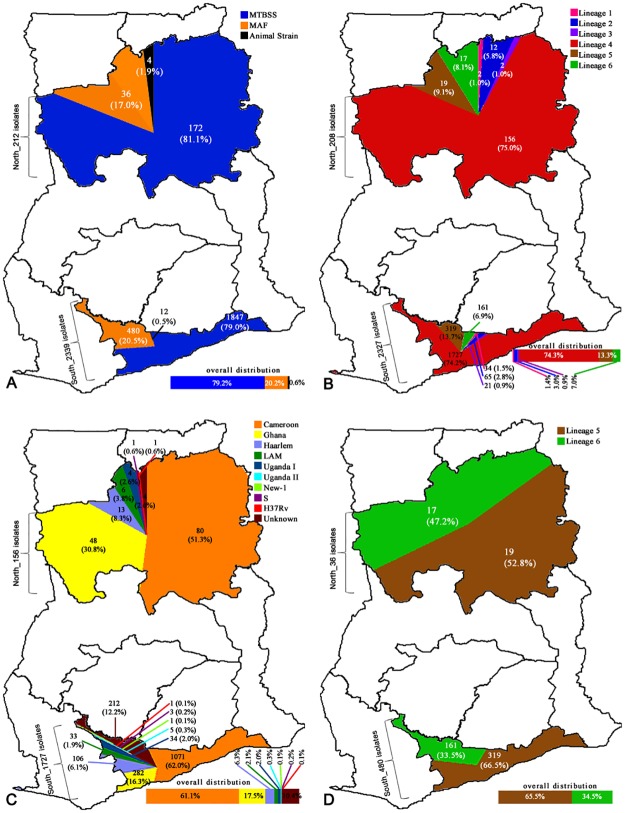
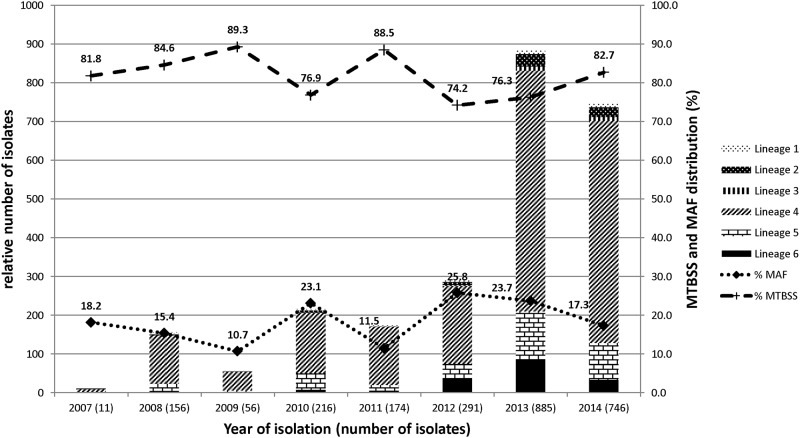
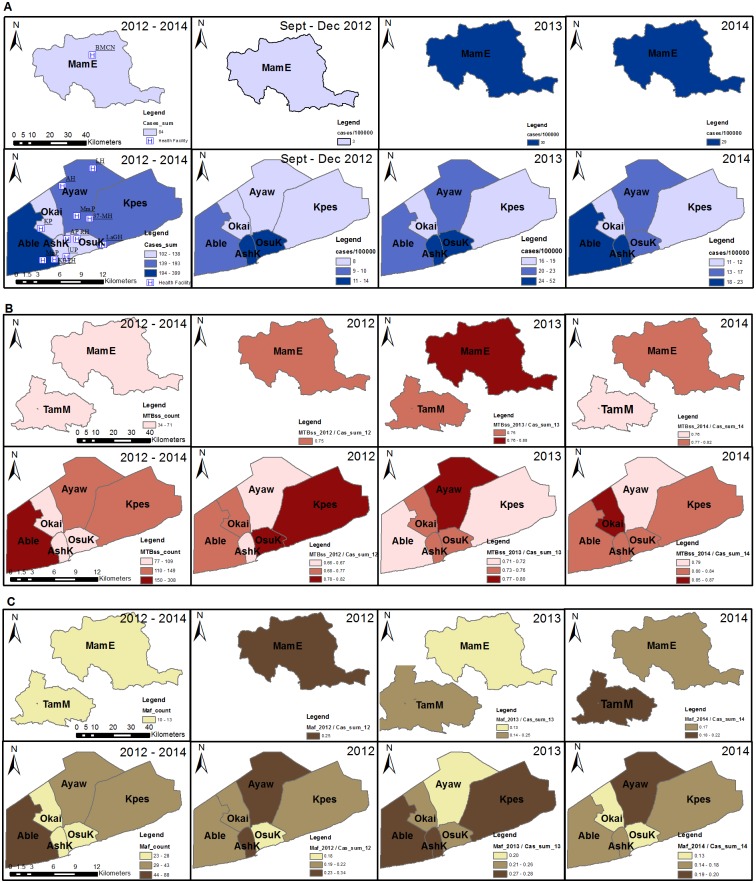
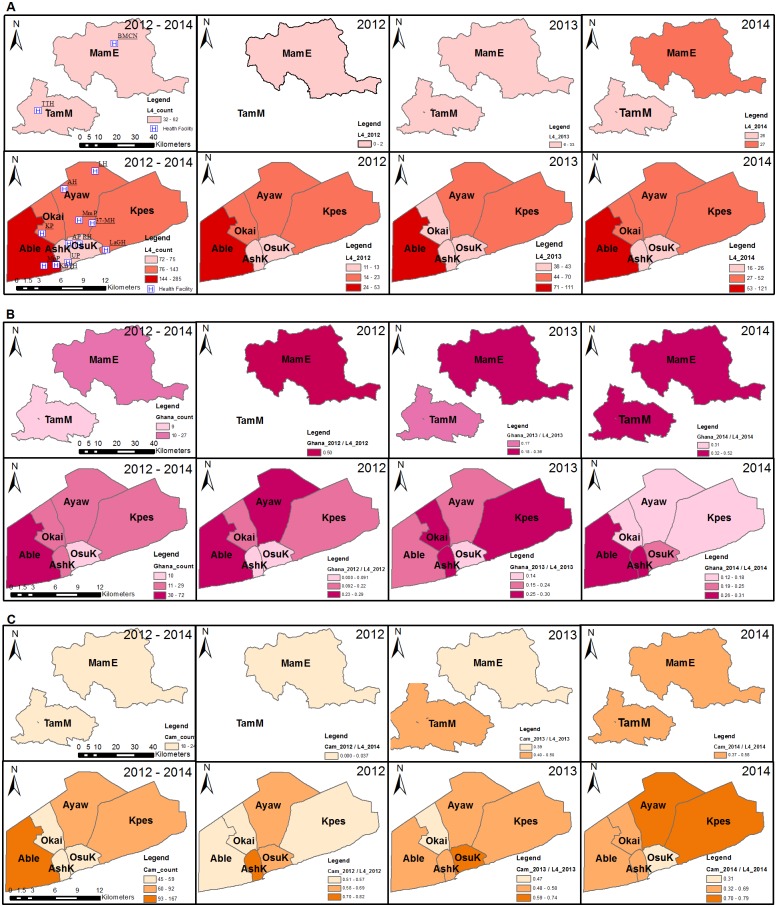
Results: Among 2,551 isolates, 2,019 (79.1%), 516 (20.2%) and 16 (0.6%) were identified as M. tuberculosis sensu stricto (MTBss), M. africanum (Maf), 15 M. bovis and 1 M. caprae, respectively. The proportions of MTBss and Maf were fairly constant within the study period. Maf spoligotypes were dominated by Spoligotype International Type (SIT) 331 (25.42%), SIT 326 (15.25%) and SIT 181 (14.12%). We found M. bovis to be significantly higher in Northern Ghana (1.9% of 212) than Southern Ghana (0.5% of 2339) (p = 0.020). Using the purely spatial and space-time analysis, seven significant MTBC lineage clusters (p< 0.05) were identified. Notable among the clusters were Ghana and Cameroon sub-lineages found to be associated with north and south, respectively.
Conclusion: This study demonstrated that overall, 79.1% of TB in Ghana is caused by MTBss and 20% by M. africanum. Unlike some West African Countries, we did not observe a decline of Maf prevalence in Ghana.
Conflict of interest statement
The authors have declared that no competing interest exist.
Figures
Similar articles
-
Molecular epidemiology of Mycobacterium tuberculosis complex in the Volta Region of Ghana.PLoS One. 2021 Mar 17;16(3):e0238898. doi: 10.1371/journal.pone.0238898. eCollection 2021. PLoS One. 2021. PMID: 33730036 Free PMC article.
-
Molecular epidemiology of bovine tuberculosis in Northern Ghana identifies several uncharacterized bovine spoligotypes and suggests possible zoonotic transmission.PLoS Negl Trop Dis. 2022 Aug 11;16(8):e0010649. doi: 10.1371/journal.pntd.0010649. eCollection 2022 Aug. PLoS Negl Trop Dis. 2022. PMID: 35951638 Free PMC article.
-
Molecular epidemiology and drug susceptibility profiles of Mycobacterium tuberculosis complex isolates from Northern Ghana.Int J Infect Dis. 2021 Aug;109:294-303. doi: 10.1016/j.ijid.2021.07.020. Epub 2021 Jul 14. Int J Infect Dis. 2021. PMID: 34273514
-
The Biology and Epidemiology of Mycobacterium africanum.Adv Exp Med Biol. 2017;1019:117-133. doi: 10.1007/978-3-319-64371-7_6. Adv Exp Med Biol. 2017. PMID: 29116632 Review.
-
Mycobacterium africanum--review of an important cause of human tuberculosis in West Africa.PLoS Negl Trop Dis. 2010 Sep 28;4(9):e744. doi: 10.1371/journal.pntd.0000744. PLoS Negl Trop Dis. 2010. PMID: 20927191 Free PMC article. Review.
Cited by
-
Molecular detection of Mycobacterium tuberculosis sensu stricto in the soil of Niger.New Microbes New Infect. 2021 Sep 1;44:100939. doi: 10.1016/j.nmni.2021.100939. eCollection 2021 Nov. New Microbes New Infect. 2021. PMID: 34621525 Free PMC article.
-
Macrophage susceptibility to infection by Ghanaian Mycobacterium tuberculosis complex lineages 4 and 5 varies with self-reported ethnicity.Front Cell Infect Microbiol. 2023 Aug 14;13:1163993. doi: 10.3389/fcimb.2023.1163993. eCollection 2023. Front Cell Infect Microbiol. 2023. PMID: 37645380 Free PMC article.
-
Genotypic and phenotypic diversity of Mycobacterium tuberculosis complex genotypes prevalent in West Africa.PLoS One. 2021 Aug 26;16(8):e0255433. doi: 10.1371/journal.pone.0255433. eCollection 2021. PLoS One. 2021. PMID: 34437584 Free PMC article.
-
Enteroparasitism in Hard-to-Reach Community Dwellers: A Cross-Sectional Study in Ga West Municipality in Ghana.J Parasitol Res. 2020 Sep 24;2020:8890998. doi: 10.1155/2020/8890998. eCollection 2020. J Parasitol Res. 2020. PMID: 33029386 Free PMC article.
-
Spatial and temporal clustering analysis of tuberculosis in the mainland of China at the prefecture level, 2005-2015.Infect Dis Poverty. 2018 Oct 20;7(1):106. doi: 10.1186/s40249-018-0490-8. Infect Dis Poverty. 2018. PMID: 30340513 Free PMC article.
References
-
- World Health Organization. Global tuberculosis report 2014. Geneva: World Health Organization; 2014.
-
- Wells AQ, Oxon DM. Tuberculosis in wild voles. Lancet i. 1937:1221.
-
- Frota CC, Hunt DM, Buxton RS, Rickman L, Hinds J, Kremer K, et al. Genome structure in the vole bacillus, Mycobacterium microti, a member of the Mycobacterium tuberculosis complex with a low virulence for humans. Microbiology. 2004;150(Pt 5):1519–27. Epub 2004/05/11. 10.1099/mic.0.26660-0 ; PubMed Central PMCID: PMCPmc2964484. - DOI - PMC - PubMed
MeSH terms
Grants and funding
LinkOut - more resources
Full Text Sources
Other Literature Sources
Medical
