

Visual Field Testing with Head-Mounted Perimeter 'imo'
- PMID: 27564382
- PMCID: PMC5001626
- DOI: 10.1371/journal.pone.0161974
Visual Field Testing with Head-Mounted Perimeter 'imo'
Abstract
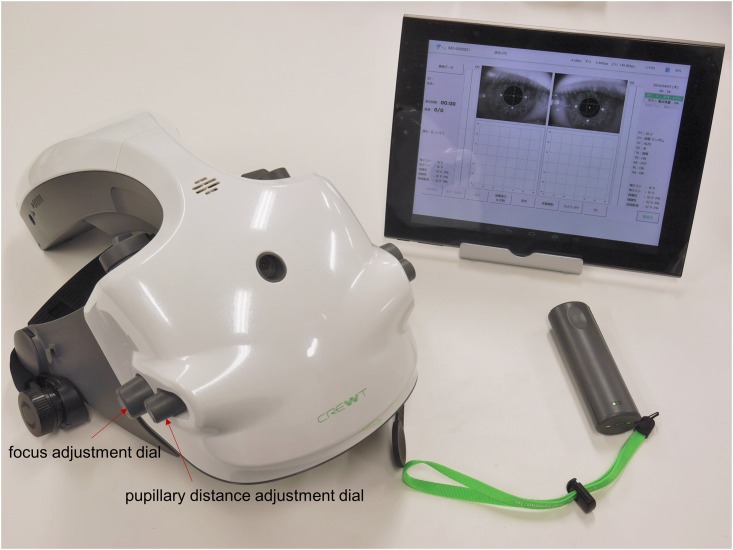
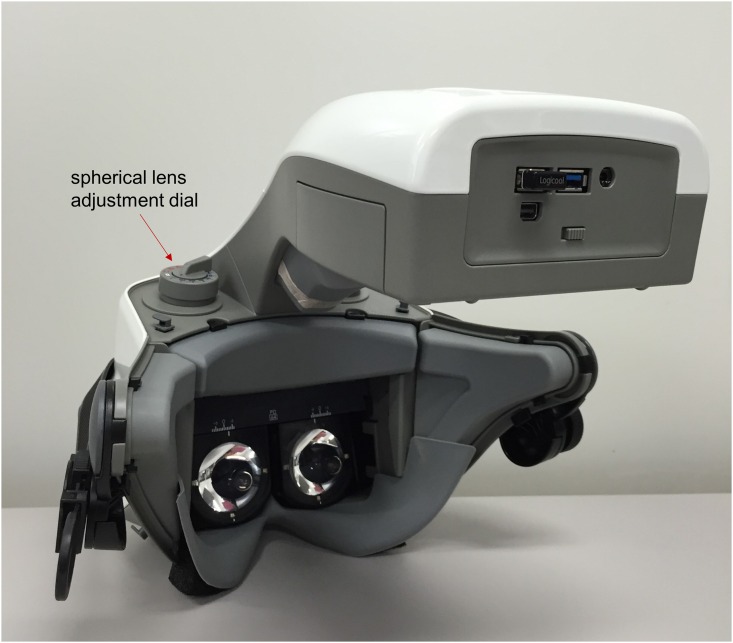
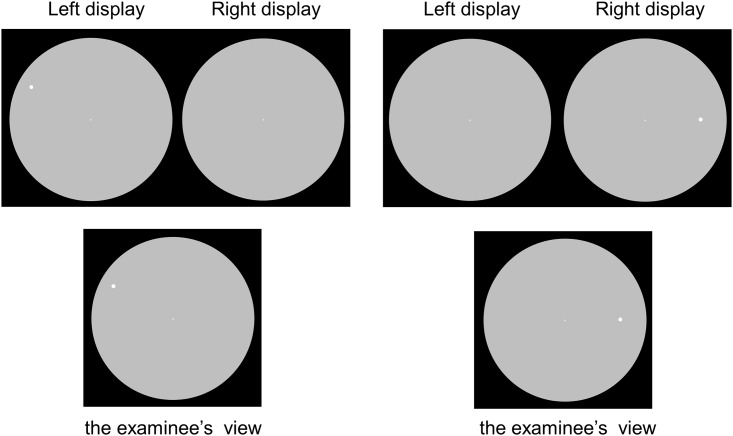
Purpose: We developed a new portable head-mounted perimeter, "imo", which performs visual field (VF) testing under flexible conditions without a dark room. Besides the monocular eye test, imo can present a test target randomly to either eye without occlusion (a binocular random single eye test). The performance of imo was evaluated.
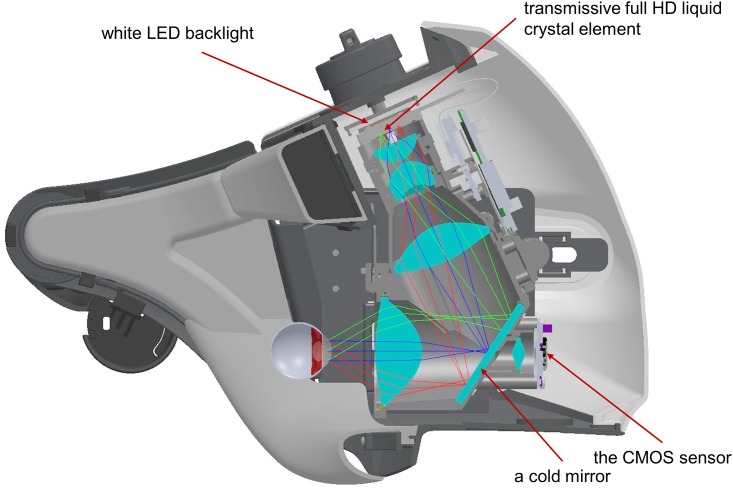
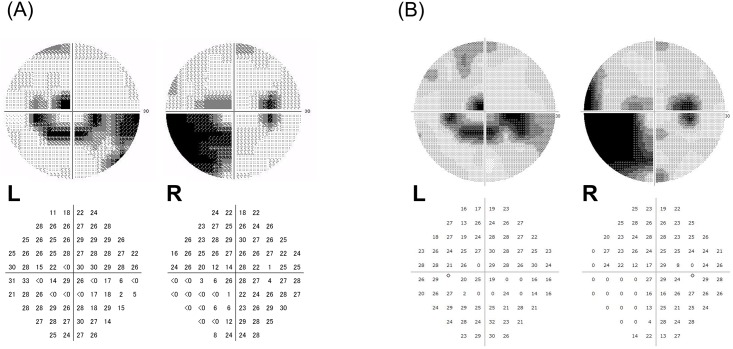
Methods: Using full HD transmissive LCD and high intensity LED backlights, imo can display a test target under the same test conditions as the Humphrey Field Analyzer (HFA). The monocular and binocular random single eye tests by imo and the HFA test were performed on 40 eyes of 20 subjects with glaucoma. VF sensitivity results by the monocular and binocular random single eye tests were compared, and these test results were further compared to those by the HFA. The subjects were asked whether they noticed which eye was being tested during the test.
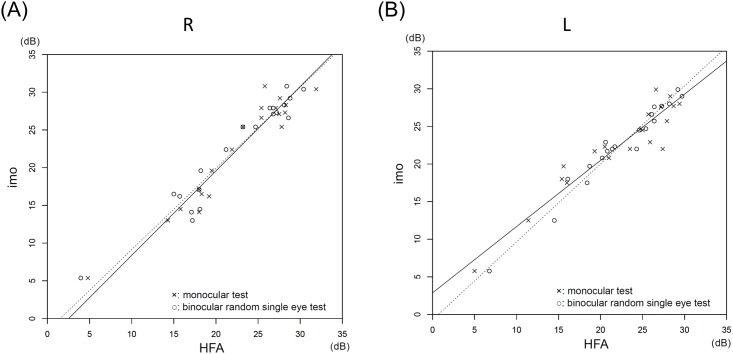
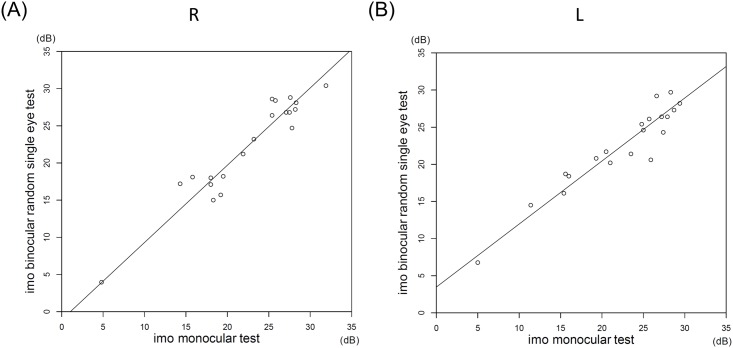
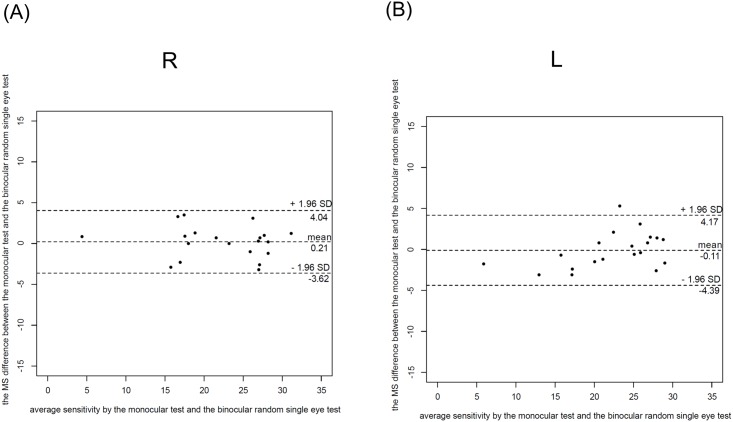
Results: The mean sensitivity (MS) obtained with the HFA highly correlated with the MS by the imo monocular test (R: r = 0.96, L: r = 0.94, P < 0.001) and the binocular random single eye test (R: r = 0.97, L: r = 0.98, P < 0.001). The MS values by the monocular and binocular random single eye tests also highly correlated (R: r = 0.96, L: r = 0.95, P < 0.001). No subject could detect which eye was being tested during the examination.
Conclusions: The perimeter imo can obtain VF sensitivity highly compatible to that by the standard automated perimeter. The binocular random single eye test provides a non-occlusion test condition without the examinee being aware of the tested eye.
Conflict of interest statement
The authors have the following interests: this study was funded by CREWT Medical Systems. SK and KY are employees of CREWT Medical Systems. SK and KY are directors and have proprietary interests with CREWT Medical Systems. This is the first study exploring the diagnostic abilities of this new instrument developed by the authors and CREWT Medical Systems. There are no products under development that are relevant to the materials presented in this article, except for the ongoing development of imo. There are patent applications issued by CM and CREWT Medical Systems. This does not alter the authors' adherence to all the PLOS ONE policies on sharing data and materials.
Figures
Similar articles
-
Comparison of central visual sensitivity between monocular and binocular testing in advanced glaucoma patients using imo perimetry.Br J Ophthalmol. 2020 Nov;104(11):1258-1534. doi: 10.1136/bjophthalmol-2019-315251. Epub 2020 Mar 9. Br J Ophthalmol. 2020. PMID: 32152139 Free PMC article.
-
Comparison of monocular sensitivities measured with and without occlusion using the head-mounted perimeter imo.PLoS One. 2019 Jan 17;14(1):e0210691. doi: 10.1371/journal.pone.0210691. eCollection 2019. PLoS One. 2019. PMID: 30653560 Free PMC article.
-
Comparison of head-mounted perimeter (imo®) and Humphrey Field Analyzer.Clin Ophthalmol. 2019 Mar 14;13:501-513. doi: 10.2147/OPTH.S190995. eCollection 2019. Clin Ophthalmol. 2019. PMID: 30936681 Free PMC article.
-
Agreement in the detection of chiasmal and postchiasmal visual field defects between imo binocular random single-eye test and Humphrey monocular test.Jpn J Ophthalmol. 2022 Sep;66(5):413-424. doi: 10.1007/s10384-022-00935-y. Epub 2022 Aug 16. Jpn J Ophthalmol. 2022. PMID: 35972588
-
Test-retest repeatability of the imo binocular random single-eye test and Humphrey monocular test in patients with glaucoma.Jpn J Ophthalmol. 2023 Sep;67(5):578-589. doi: 10.1007/s10384-023-01007-5. Epub 2023 Jul 1. Jpn J Ophthalmol. 2023. PMID: 37392238
Cited by
-
Comparison of the TEMPO binocular perimeter and Humphrey field analyzer.Sci Rep. 2023 Dec 1;13(1):21189. doi: 10.1038/s41598-023-48105-5. Sci Rep. 2023. PMID: 38040803 Free PMC article. Clinical Trial.
-
Comparison of IMO vifa24plus(1-2) and Humphrey Field Analyzer 24-2.Clin Ophthalmol. 2025 Jan 30;19:301-307. doi: 10.2147/OPTH.S506059. eCollection 2025. Clin Ophthalmol. 2025. PMID: 39902283 Free PMC article.
-
Advanced Vision Analyzer-Virtual Reality Perimeter: Device Validation, Functional Correlation and Comparison with Humphrey Field Analyzer.Ophthalmol Sci. 2021 Jun 25;1(2):100035. doi: 10.1016/j.xops.2021.100035. eCollection 2021 Jun. Ophthalmol Sci. 2021. PMID: 36249304 Free PMC article.
-
Immersive virtual reality gameplay detects visuospatial atypicality, including unilateral spatial neglect, following brain injury: a pilot study.J Neuroeng Rehabil. 2023 Nov 23;20(1):161. doi: 10.1186/s12984-023-01283-9. J Neuroeng Rehabil. 2023. PMID: 37996834 Free PMC article.
-
From real world data to real world evidence to improve outcomes in neuro-ophthalmology.Eye (Lond). 2024 Aug;38(12):2448-2456. doi: 10.1038/s41433-024-03160-8. Epub 2024 Jun 6. Eye (Lond). 2024. PMID: 38844583 Free PMC article. Review.
References
-
- Nagata S, Kani K. A new perimetry based on eye movement In: A. H, editor. Perimetry Update 1988/1989. Amsterdam Berkeley, Milano: Kugler & ghedini; 1997. p. 337–40.
-
- Bland JM, Altman DG. Statistical methods for assessing agreement between two methods of clinical measurement. Lancet. 1986;1(8476):307–10. . - PubMed
-
- Fuhr PS, Hershner TA, Daum KM. Ganzfeld blankout occurs in bowl perimetry and is eliminated by translucent occlusion. Arch Ophthalmol. 1990;108(7):983–8. . - PubMed
MeSH terms
LinkOut - more resources
Full Text Sources
Other Literature Sources
