. 2016 Aug 26;11(8):e0157655.
doi: 10.1371/journal.pone.0157655. eCollection 2016.

On the Potential of a New Generation of Magnetometers for MEG: A Beamformer Simulation Study

Affiliations

On the Potential of a New Generation of Magnetometers for MEG: A Beamformer Simulation Study

Elena Boto et al. PLoS One. .

Abstract

Magnetoencephalography (MEG) is a sophisticated tool which yields rich information on the spatial, spectral and temporal signatures of human brain function. Despite unique potential, MEG is limited by a low signal-to-noise ratio (SNR) which is caused by both the inherently small magnetic fields generated by the brain, and the scalp-to-sensor distance. The latter is limited in current systems due to a requirement for pickup coils to be cryogenically cooled. Recent work suggests that optically-pumped magnetometers (OPMs) might be a viable alternative to superconducting detectors for MEG measurement. They have the advantage that sensors can be brought to within ~4 mm of the scalp, thus offering increased sensitivity. Here, using simulations, we quantify the advantages of hypothetical OPM systems in terms of sensitivity, reconstruction accuracy and spatial resolution. Our results show that a multi-channel whole-head OPM system offers (on average) a fivefold improvement in sensitivity for an adult brain, as well as clear improvements in reconstruction accuracy and spatial resolution. However, we also show that such improvements depend critically on accurate forward models; indeed, the reconstruction accuracy of our simulated OPM system only outperformed that of a simulated superconducting system in cases where forward field error was less than 5%. Overall, our results imply that the realisation of a viable whole-head multi-channel OPM system could generate a step change in the utility of MEG as a means to assess brain electrophysiological activity in health and disease. However in practice, this will require both improved hardware and modelling algorithms.


Conflict of interest statement

The authors have declared that no competing interests exist.

Figures

Fig 1
Fig 1. “Brain noise” sources.
Schematic showing a single example of the relative locations of the source of interest (black) and the interference generators (green). (A) Case 1 (Interference in close proximity) and (B) Case 2 (Deep sources).
Fig 2
Fig 2. Schematic diagram of forward field error simulation.
The perfect forward field, lj is perturbed via addition of Δlj to give j.
Fig 3
Fig 3. SNR simulation.
(A) Simulation set-up; the upper panel shows the coil arrangement for the sSQUID system, based on the axial gradiometer configuration of the 275 channel CTF MEG instrument. The lower panel shows our sOPM system; note 5 cm baseline axial gradiometers are used to allow a direct comparison of the sSQUID and sOPM systems. (B) Simulated magnetic field from a single dipole located in the parietal lobe. Note the increased magnitude and more focal nature of the measured magnetic field patterns. (C) The ratio of the Frobenius norms of the forward fields, plotted as a function of dipole location on the cortex. The colours represent the quantity fj,OPM/fj,SQ; i.e. a ratio of 5 would indicate a fivefold improvement in SNR of the sOPM compared to the sSQUID system (assuming equal noise floors). The left and right panels show different aspects of the same data.
Fig 4
Fig 4. Reconstruction accuracy.
(A) The left hand panel shows beamformer reconstruction accuracy for the sSQUID system. The right hand panel shows beamformer reconstruction accuracy for the sOPM system. In both cases reconstruction accuracy is measured as temporal correlation between the simulated and reconstructed dipole time courses. Colours represent the quantities rSQ(qj,j) and rOPM(qj,j) for left and right panels, respectively. Note the improvement for the sOPM system. (B) Spatial reconstruction accuracy around four cortical locations (in black). The four inset graphs show correlation coefficients between the original simulated time course and reconstructed dipole time courses at the simulated source location and its nearest neighbours (shown in green on the central image). Correlation is plotted as a function of Euclidean distance to the simulated dipole. Note that for both systems, correlation is maximal closest to the simulated source, however correlation falls off more quickly with distance for the sOPM system, indicating a better spatially resolved image.
Fig 5
Fig 5. Reconstruction accuracy with “brain noise”.
(A) Case 1 (interference in close proximity): left hand panel shows average of correlation coefficients between simulated and reconstructed dipole time courses, r(qj,j), with and without interference. Right hand panel shows average of correlation coefficients between each of the interference sources and the reconstructed main dipole time course, i.e. rInt(qInt,k,j). (B) Case 2 (deep sources): left hand panel represents the average of correlation coefficients between the estimated and the simulated dipole time course, with and without interference sources. Right hand panel shows again average of correlation coefficients with sources of interference.
Fig 6
Fig 6. Dependency of reconstruction accuracy on forward field error.
Left image shows dipole locations with deep sources shown in grey and shallower sources shown in black. The plots on the right show temporal correlation between the simulated and beamformer reconstructed sources (i.e. r(qj,j)) plotted as a function of fractional error on forward field (‖Δlj‖/‖lj‖). The two separate plots show the case for deep (top) and shallow (bottom) dipoles. The sOPM system is shown in blue and the sSQUID system in red. Note that the improvement in reconstruction accuracy afforded by the OPM based system depends on accurate forward field modelling.
Fig 7
Fig 7. Spatial resolution and channel count measurements.
(A) Correlation coefficient between two simulated dipole sources after beamforming reconstruction, r(k,n) plotted against Euclidean distance between the sources. The red and blue traces show the results for the sSQUID system and sOPM systems, respectively. Note that the simulated sources were temporally uncorrelated, so a value of zero would indicate perfect reconstruction. Note the improved performance of the sOPM compared to the sSQUID system. The inset shows correlation coefficients between simulated and reconstructed time courses for the two sources separately, i.e. r(qk,k) and r(qn,n). (B) Simulation set-up comparing four different sOPM systems (from top to bottom): 81 sensors following the 10–10 EEG system; 275 sensors (equivalent to that shown in Fig 1A); 329 sensors following the 10–5 system; 1293 sensors following a hypothetical 10–2.5 system. (C) Comparison of spatial resolution for the 81, 275, 329 and 1293 sensor sOPM systems. Again the graphs show correlation between reconstructed time courses plotted as a function of Euclidean distance between sources. Note the improvement in performance as channel count is increased.
Fig 8
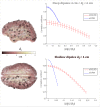
Fig 8. Spatial resolution (275 channels).
(A) Minimum distance between the dipole seed and its neighbours for which two sources are separable (defined when temporal correlation between time courses falls below 1/√2) plotted as a function of seed dipole location. Left hand panel shows results for the sSQUID system and right hand panel shows results for the sOPM system. Importantly, the discrete nature of the cortical mesh means that a dipole separation corresponding to a temporal correlation of precisely 1/√2 is not possible. For this reason, the spatial separations in Fig 8A must be given alongside their corresponding temporal correlation values which are shown in (B). The left and right hand panels correspond to sSQUID and sOPM systems respectively. Note smaller spatial separations can be achieved with the sOPM system compared to the sSQUID system (A), especially in the temporal lobe. Note also that in addition to smaller separation, leakage (temporal correlation) is also reduced dramatically (B).

References

    1. Cohen D. Magnetoencephalography: evidence of magnetic fields produced by alpha-rhythm currents. Science. 1968;161(3843):784–6. - PubMed
    1. Cohen D. Magnetoencephalography: detection of the brain's electrical activity with a superconducting magnetometer. Science. 1972;175(4022):664–6. - PubMed
    1. Hämäläinen M, Hari R, Ilmoniemi RJ, Knuutila J, Lounasmaa OV. Magnetoencephalography—theory, instrumentation, and applications to noninvasive studies of the working human brain. Reviews of Modern Physics. 1993;65(2):413.
    1. Vrba J, Anderson G, Betts K, Burbank M, Cheung T, Cheyne D, et al. 151-Channel whole-cortex MEG system for seated or supine positions In: Yoshimoto T, Kotani M, Kuriki S, Karibe H, Nakasato N, editors. Recent Advances in Biomagnetism. Sendai, Japan: Tohoku University Press; 1999. p. 93–6.
    1. Hämäläinen MS, Ilmoniemi RJ. Interpreting magnetic fields of the brain: minimum norm estimates. Medical & Biological Engineering & Computing. 1994;32(1):35–42. - PubMed