. 2016 Aug 26:5:e16582.
doi: 10.7554/eLife.16582.

Seipin is required for converting nascent to mature lipid droplets

Affiliations

Seipin is required for converting nascent to mature lipid droplets

Huajin Wang et al. Elife. .

Abstract

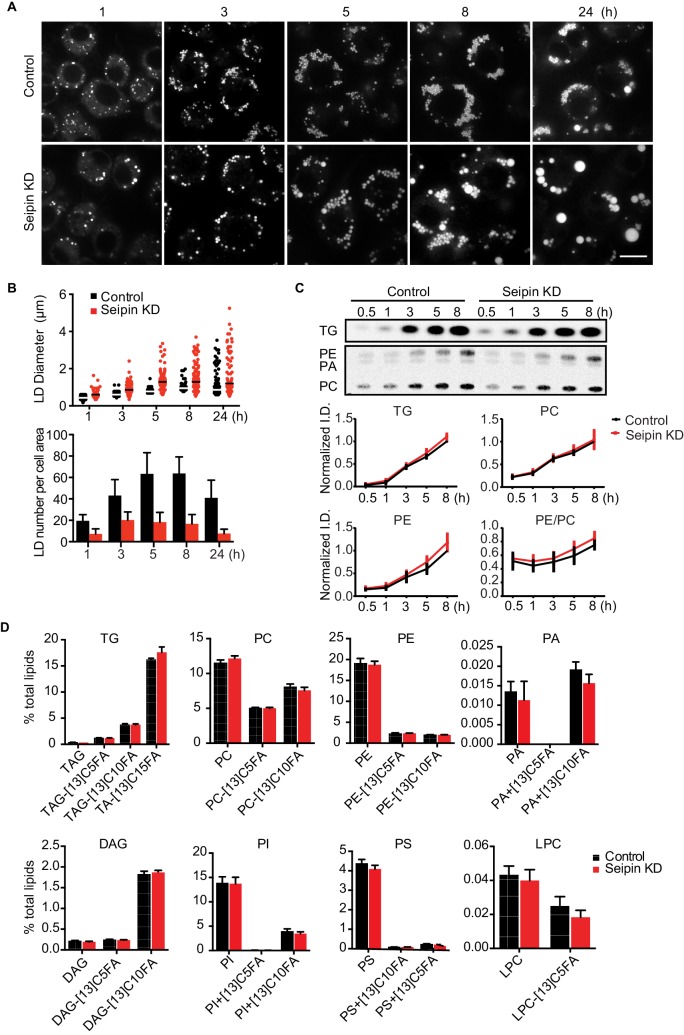
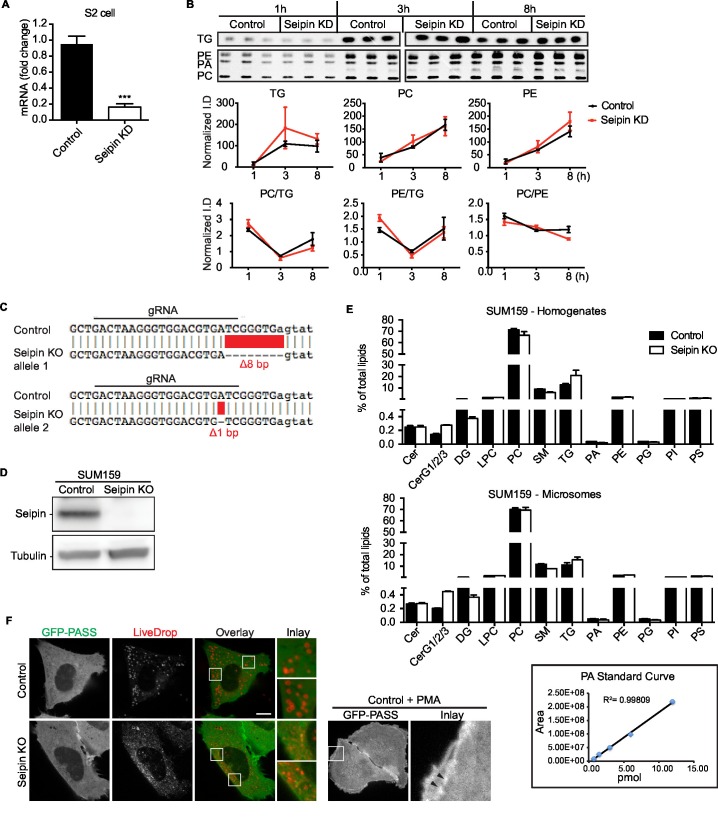
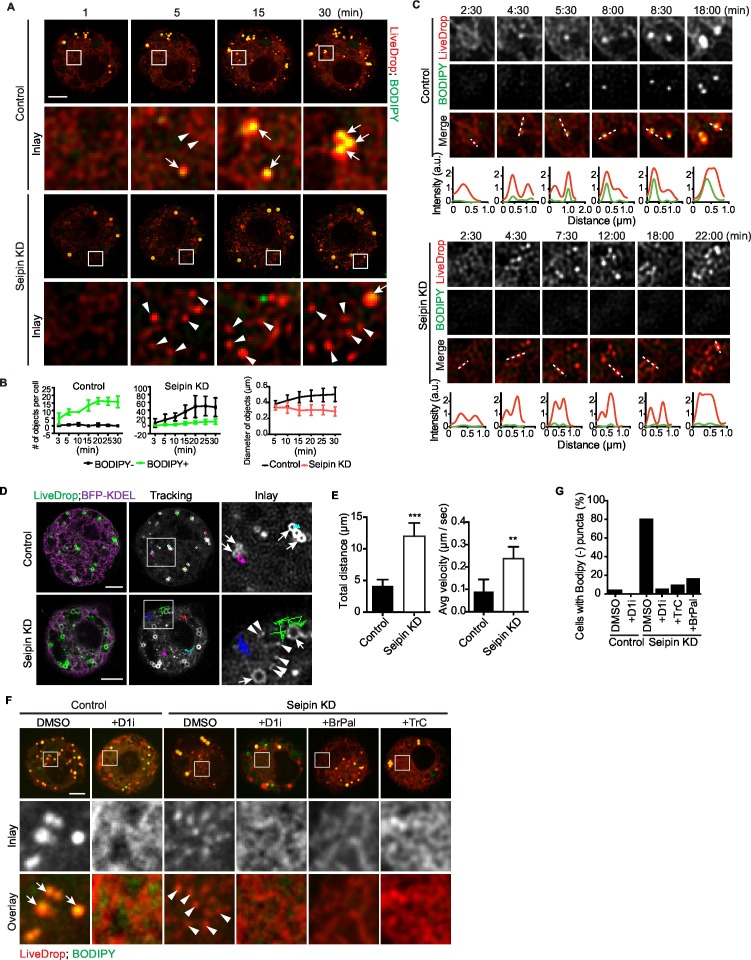
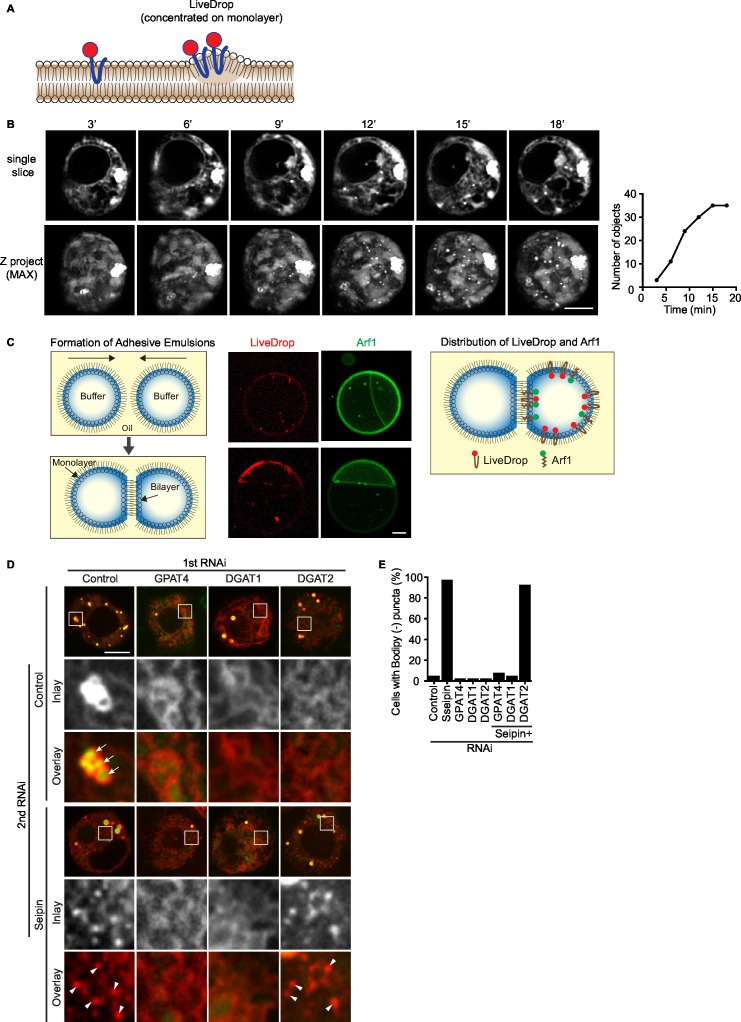
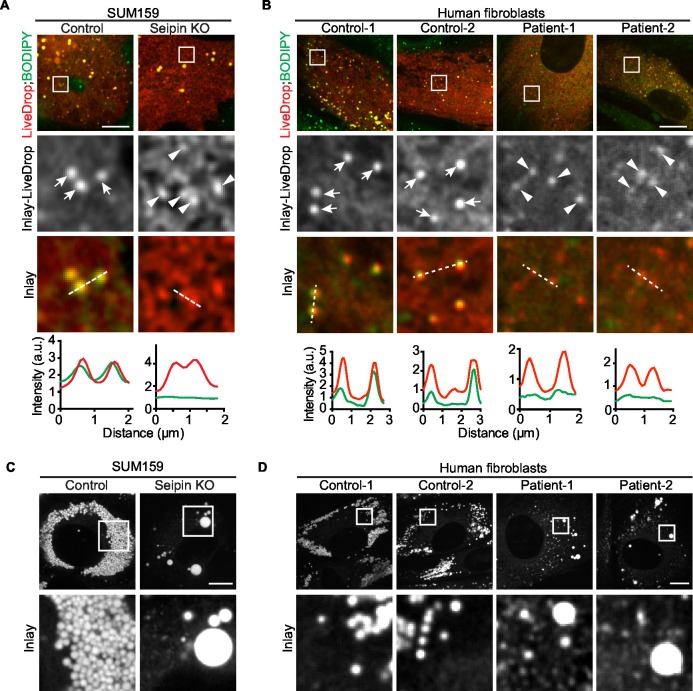
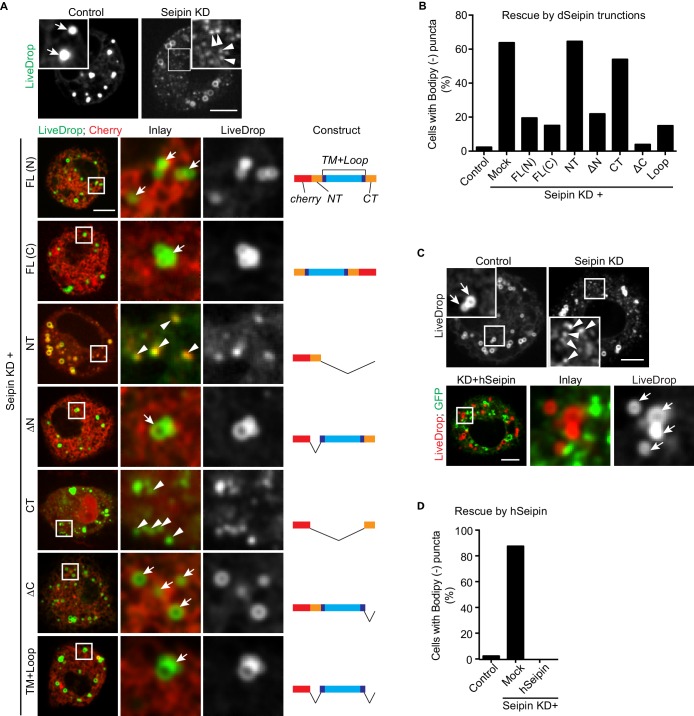
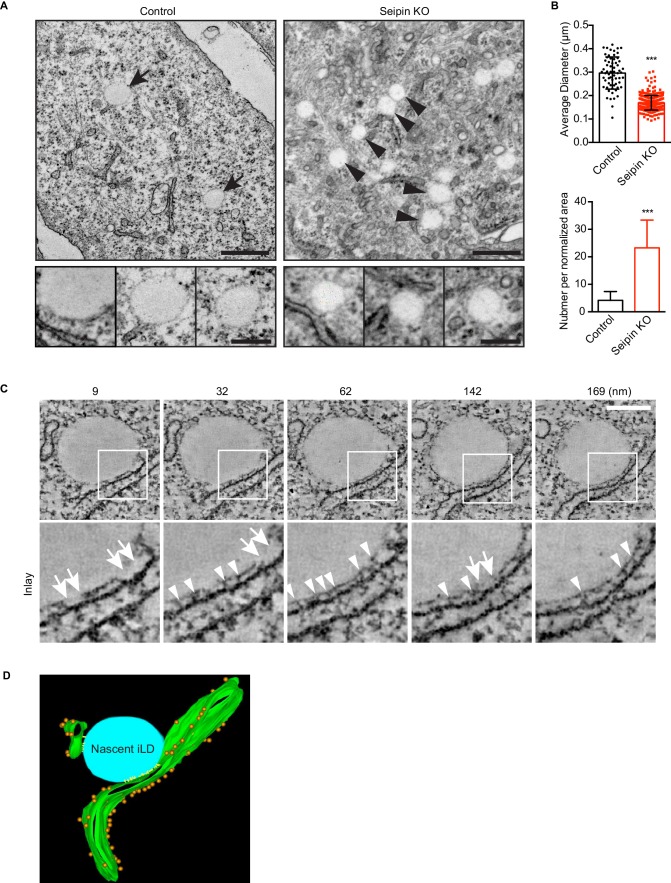
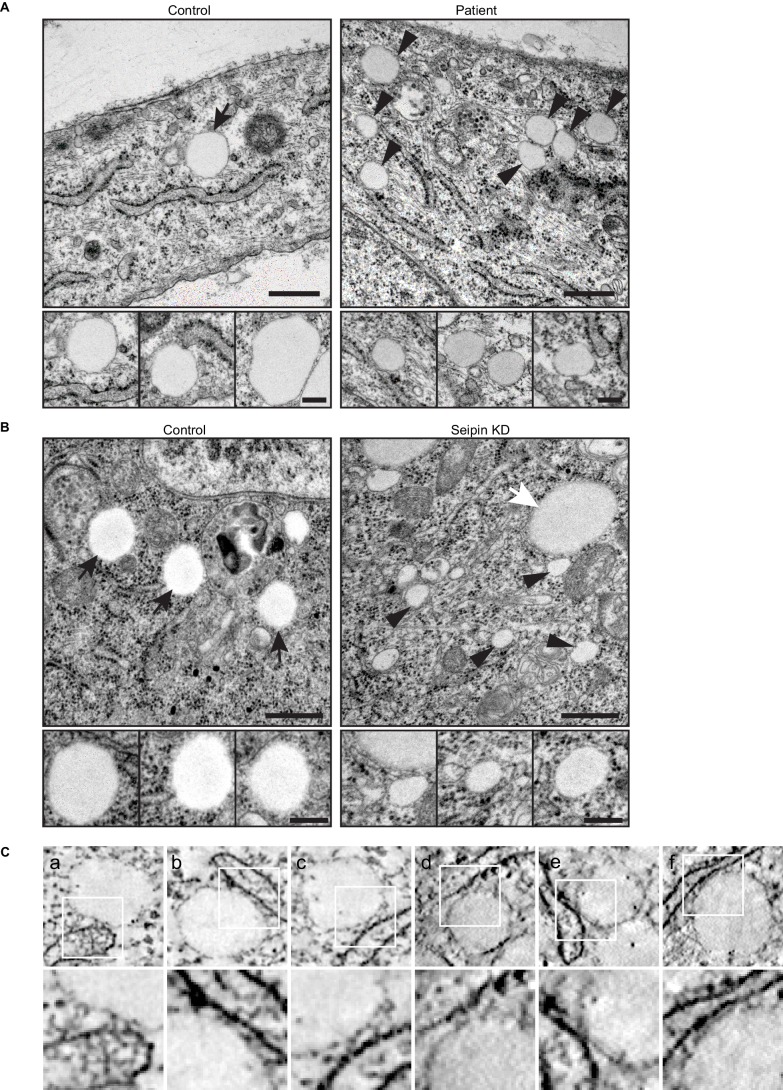
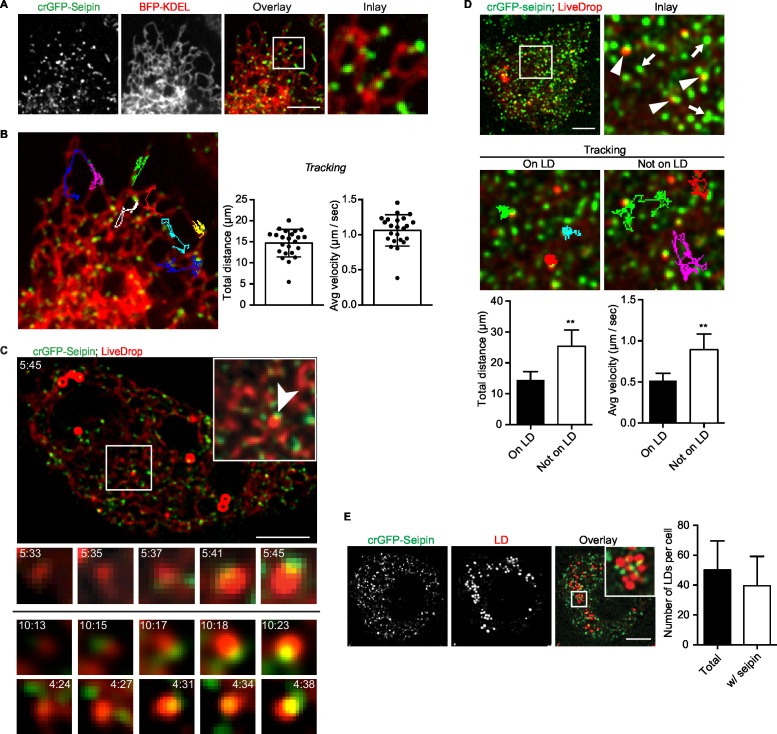
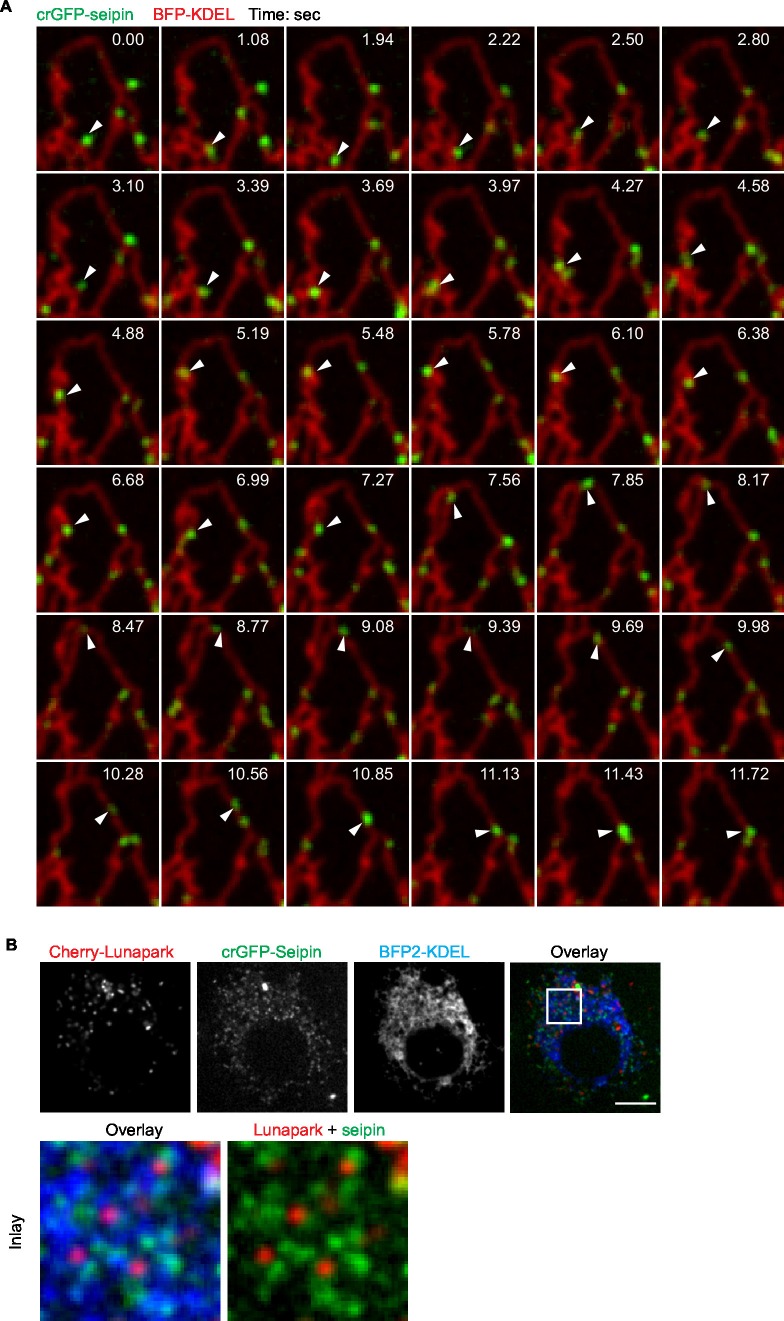
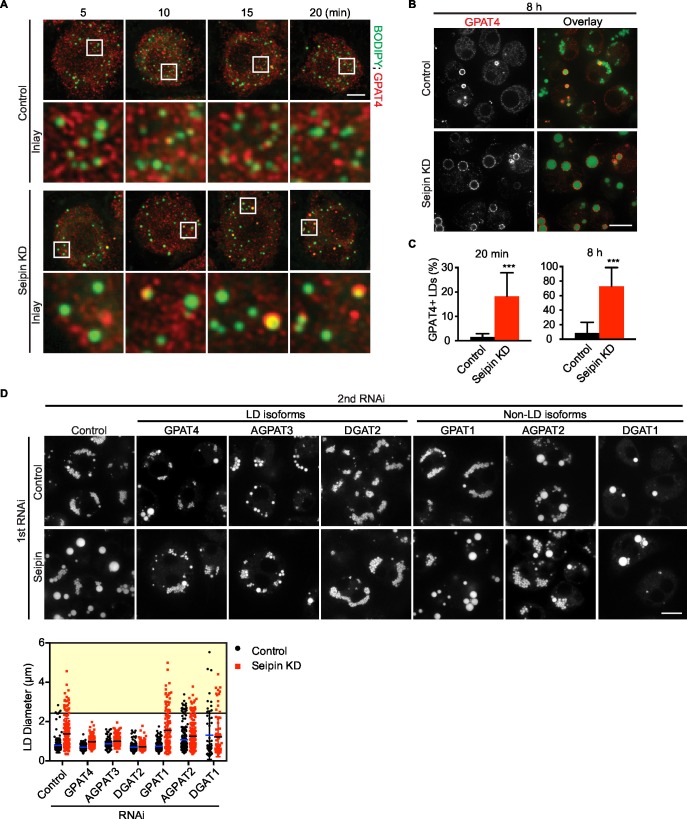
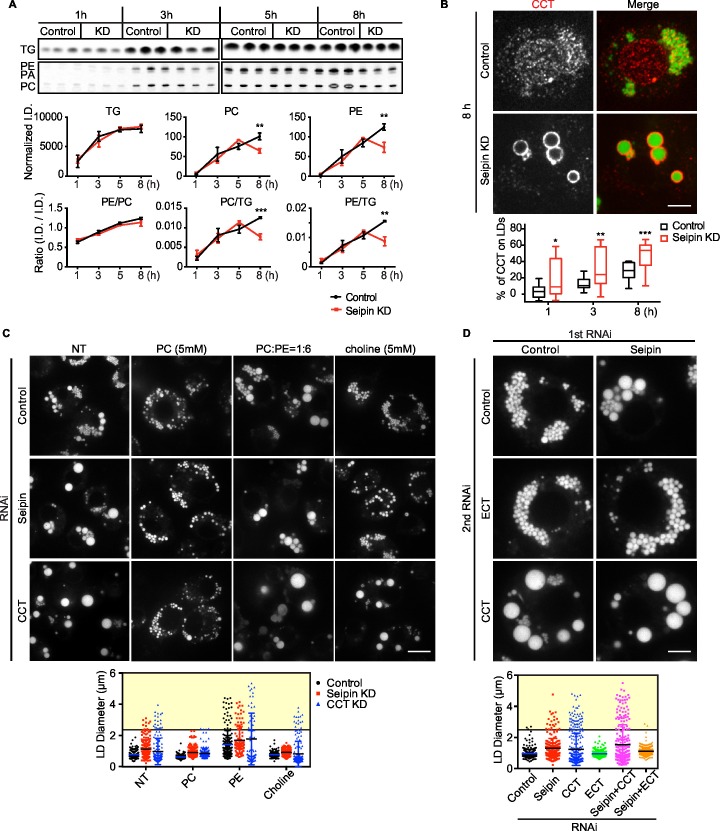
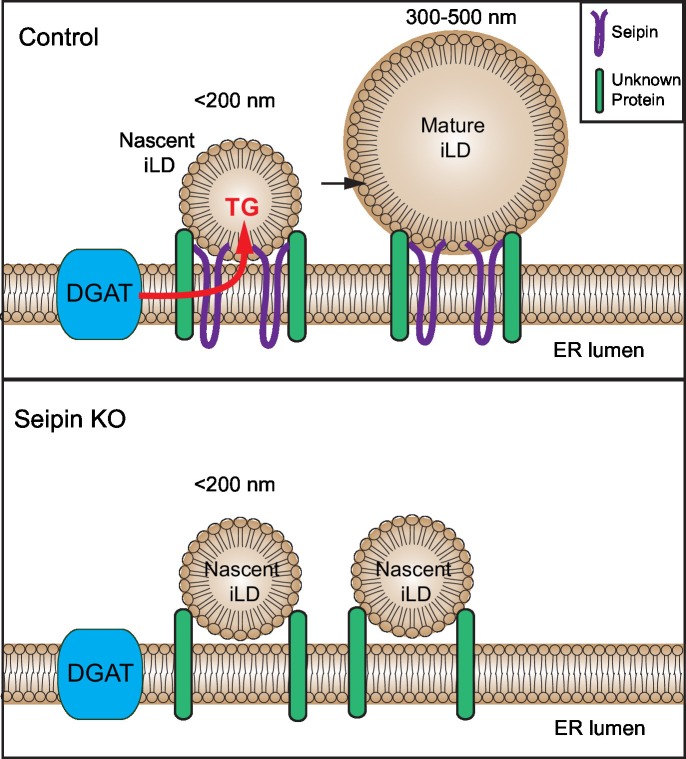
How proteins control the biogenesis of cellular lipid droplets (LDs) is poorly understood. Using Drosophila and human cells, we show here that seipin, an ER protein implicated in LD biology, mediates a discrete step in LD formation-the conversion of small, nascent LDs to larger, mature LDs. Seipin forms discrete and dynamic foci in the ER that interact with nascent LDs to enable their growth. In the absence of seipin, numerous small, nascent LDs accumulate near the ER and most often fail to grow. Those that do grow prematurely acquire lipid synthesis enzymes and undergo expansion, eventually leading to the giant LDs characteristic of seipin deficiency. Our studies identify a discrete step of LD formation, namely the conversion of nascent LDs to mature LDs, and define a molecular role for seipin in this process, most likely by acting at ER-LD contact sites to enable lipid transfer to nascent LDs.

Keywords: D. melanogaster; LiveDrop; cell biology; endoplasmic reticulum; human; lipid droplet; lipid metabolism; organelle biogenesis; seipin.


Conflict of interest statement

The authors declare that no competing interests exist.

Figures

Figure 1.
Figure 1.. Seipin depletion alters LD morphology without affecting cellular lipid synthesis or composition in Drosophila S2 cells.
(A) Time course of LD formation in control and seipin knockdown (KD) cells. S2 cells were treated with 1 mM oleic acid for the indicated times, and LDs were stained with BODIPY 493/503. Bar, 10 μm. (B) Quantification of LD formation over time. Top, LD diameters; lines show median. Bottom, average LD numbers per cell area. n = 20. (C) Seipin deficiency does not affect cellular glycerolipid synthesis. Cells were pulse-labeled with [14C]-oleic acid (100 μCi/μmol) for indicated times. Phospholipids and neutral lipids were extracted and separated by TLC. The TLC plate was exposed on an imaging screen, and the intensities of bands were quantified with FIJI software. Values are presented as integrated density normalized to protein concentration. n=3. (D) Seipin does not affect the flux and steady-state levels of lipids by lipidomics. Cells were labeled with [13C5]-oleic acid for 3 hr. Lipids were extracted, and lipid classes and species were identified by shotgun mass spectrometry–based lipidomics. n=3 biological replicates and 2 technical replicates. DOI: http://dx.doi.org/10.7554/eLife.16582.003
Figure 1—figure supplement 1.
Figure 1—figure supplement 1.. Seipin does not affect cell lipid synthesis or composition.
(A) Typical efficiency of seipin knockdown with dsRNA in Drosophila S2 cells. Primers for dsRNA and qPCR are described in Supplementary file 1. n=3. ***p<0.001. (B) Glycerolipid synthesis in the ER is not affected by seipin knockdown in Drosophila S2 cells. Metabolic labeling of cells was as described in Figure 1C. Microsomes were purified, and lipids were extracted, separated with TLC, exposed on an imaging screen, and quantified with FIJI software. n=3. No significant change was observed. (C) Sequence analysis of seipin knockout clone. Seipin knockout clone of SUM159 cell line was generated with CRISPR/Cas9-mediated genome editing. Genomic DNA was extracted and sequenced. The seipin knockout clones contain heterozygous mutations in exon 3, with an 8-nucleotide deletion on one allele and a 1-nucleotide deletion on the other, leading to frame shift in both alleles. (D) Expression of seipin protein in wildtype and seipin knockout SUM159 cells was examined by western blot with antibody against endogenous seipin. No detectable seipin protein was found in the seipin knockout clone. (E) Seipin does not affect lipid levels in SUM159 cells. Lipids were extracted from cell homogenate and microsomes of wildtype or seipin knockout SUM159 cells. Lipid classes and species were identified with LC-MS based lipidomics. n=3 biological replicates and 2 technical replicates. PA standard curve shows that PA measurement was linear at a concentration range similar to that in samples, as low as 0.75 pmol. (F) No apparent PA accumulation at LD formation sites in seipin-depleted cells. SUM159 cells co-transfected with cherry-LiveDrop and GFP-PASS were imaged 30 min after adding oleic acid. The majority of the cherry and GFP signal does not overlap at the LD formation site. As a positive control, addition of PMA to control cells induced GFP-PASS distribution to the plasma membrane (arrowhead). DOI: http://dx.doi.org/10.7554/eLife.16582.004
Figure 1—figure supplement 2.
Figure 1—figure supplement 2.. Seipin knockdown does not affect ER morphology or stress.
(A) Cells were transfected with an ER marker cherry-sec61 (Drosophila S2) or ss-BFP-KDEL (SUM159 and human fibroblasts) and imaged as Z stacks. Bars, 5 μm. Images from three independent experiments, containing ~45 cells for each genotype, from each cell type, were scrambled and blind scored by four independent observers. No difference in ER morphology between control and seipin-depleted cells was reported. X2=0.9999. (B) Seipin depletion does not induce ER stress. WT or seipin-knockout SUM159 cells and fibroblasts from healthy controls or seipin loss-of-function patients were treated with or without Thapsigargin (1 μM, 6 hr) and examined for ER stress. Xbp-1 splicing was determined by qPCR (top), and protein levels of ER stress markers, BiP and Ire1, were determined by western blotting. Representative results are shown. (C) Seipin depletion does not aggravate ER stress under fatty acid–loaded conditions. Wildtype or seipin knockout SUM159 cells were treated with oleic acid (0.5 mM), palmitate (0.1 mM), or thapsigargin (1 μM) for the indicated times and examined for ER stress by qPCR (top), and BiP and CHOP protein levels (bottom). DOI: http://dx.doi.org/10.7554/eLife.16582.005
Figure 2.
Figure 2.. Aberrant accumulation of BODIPY-negative LiveDrop puncta in seipin-depleted Drosophila S2 cells.
(A) Control or seipin knockdown cells expressing cherry-LiveDrop were treated with oleic acid immediately before the movie was taken at 30 s intervals for 30 min. Images were deconvolved as described in Materials and methods. Frames at indicated time points are shown. Green, BODIPY; red, cherry-LiveDrop. Arrow, BODIPY positive LDs; arrowhead, BODIPY negative puncta. Bar, 5 μm. (B) Quantification of numbers and size of LiveDrop objects that are positive or negative for BODIPY from movies taken at single optical plane. n=4. (C) Accumulation of LiveDrop puncta and BODIPY over time. Graphs show line profiles for each channel at indicated lines. Objects accumulate BODIPY overtime in control but not seipin knockdown cells. (D) LiveDrop puncta in the absence of seipin are highly mobile. Cells expressing GFP-LiveDrop and BFP-KDEL were incubated with oleic acid for 30 min, before live-cell images were taken at max speed (~0.38 s/frame) for 1 min. Movement of LiveDrop puncta are tracked with FIJI software. Representative tracks are shown. Bars, 5 μm. (E) Speed and distance of LiveDrop puncta movement were measured with FIJI. n= 3 cells, 8 puncta per cell. **p<0.005; ***p<0.001. (F) Presence of LiveDrop puncta in seipin-knockdown cells depends on TG synthesis. Cells expressing cherry-LiveDrop were treated with oleic acid for 30 min in the presence or absence of various TG synthesis inhibitors. D1i: DGAT1 inhibitor; BrPal: bromopalmitate; TrC: triacin C. Bar, 5 μm. Quantification of cells with abnormal accumulations of BODIPY negative, LiveDrop puncta are shown in (G). Representative results from two independent experiments are shown. 40 cells from each condition were quantified. DOI: http://dx.doi.org/10.7554/eLife.16582.006
Figure 2—figure supplement 1.
Figure 2—figure supplement 1.. Characterization of LiveDrop as an LD formation marker.
(A) Illustration of cherry-LiveDrop. LiveDrop contains a hairpin protein that preferentially partitions to monolayer membranes at the interface of neutral lipids. (B) Initial LD formation in Drosophila S2 cells captured by lattice light-sheet microscopy. Entire cell volume of cells expressing cherry-LiveDrop were imaged every 4 s using a lattice light-sheet microscope by scanning the light-sheet along with the detection objective at 200 nm step size. Images are presented as middle slice and Z project at indicated times. LiveDrop clearly highlights forming LDs over time. Graph shows the increase in LD number with time. (C) LiveDrop preferentially partitions to monolayer but not bilayer membranes. Adhesive emulsion was formed by pushing two inside-out oil droplets together. Cherry-LiveDrop and Arf1-alexa488 were added as describe in Materials and methods. LiveDrop is enriched at oil-water interface, compared to Arf1. Two examples are shown. Bar, 20 μm. (D) LiveDrop puncta accumulation in seipin depletion in Drosophila S2 cells depends on TG synthesis. Expression of seipin or seipin in combination with enzymes along TG synthesis pathways was inhibited with dsRNAs, before cells were transfected with cherry-LiveDrop and treated with oleic acid for 30 min. Green, BODIPY; red, LiveDrop. Arrow, BODIPY positive LDs; arrowhead, BODIPY negative LiveDrop puncta. Bar, 5 μm. Quantification of cells with abnormal accumulations of BODIPY-negative LiveDrop puncta are shown in (E), using the same method described in Figure 2G. Representative result from two independent experiments is shown. 40 cells from each condition were quantified. DOI: http://dx.doi.org/10.7554/eLife.16582.007
Figure 2—figure supplement 2.
Figure 2—figure supplement 2.. LiveDrop is present in the LD fraction.
SUM159 seipin KO cells transfected with Cherry-LiveDrop were fractionated by density centrifugation and protein enrichment in each fraction was determined by Western blot. Cherry-LiveDrop is enriched in the LD fraction. DOI: http://dx.doi.org/10.7554/eLife.16582.008
Figure 3.
Figure 3.. Seipin’s functions in initial LD formation and late LD phenotype are evolutionarily conserved.
(A) LiveDrop puncta accumulate in SUM159 mammary carcinoma cells lacking seipin. Cells were incubated with oleic acid for 30 min before imaging. Red, cherry-LiveDrop; green, BODIPY. Arrows, BODIPY positive LDs; arrowheads, BODIPY negative LiveDrop puncta. Bar, 5 μm. Graphs show the line profile for each channel at dotted lines. (B) LiveDrop puncta accumulate in primary human fibroblasts from two subjects with lipodystrophy due to BSCL2 loss-of-function mutations (patient 1, p.A212fsX231; patient 2, p.T109Nfs*5 & p.P65Gfs*28). Bar, 5 μm. (C) LD phenotype in seipin knockout SUM159 cells at late stage of formation. Cells were treated with oleic aicd for 16 hr before imaging. Bar, 5 μm. (D) LD phenotype during late stage of formation in primary fibroblasts from healthy controls or lipodystrophy patients. Bar, 10 μm. DOI: http://dx.doi.org/10.7554/eLife.16582.013
Figure 4.
Figure 4.. The conserved transmembrane domains and ER luminal loop of seipin are important for its function in initial LD formation in Drosophila S2 cells.
(A) Prevention of the seipin-depletion phenotype by expression of the transmembrane domains and ER loop, but not by the N- or C-terminus of Drosophila seipin. Gene knockdowns were performed with control or seipin dsRNAs targeting 3′UTR region of seipin. Cells were then co-transfected with GFP-LiveDrop (green) and cherry-tagged Drosophila seipin truncation mutants (red). Seipin constructs used are illustrated on the right. Cells were treated with oleic acid for 30 min before imaging. Arrows, BODIPY-positive LDs; arrowheads, BODIPY-negative LiveDrop puncta. Bars, 5 μm. Quantification of cells with abnormal accumulations of BODIPY-negative LiveDrop puncta are shown in (B). Representative results from two independent experiments are shown. 40 cells from each condition were quantified. (C) Expression of human seipin (hSeipin) prevents the seipin-depletion phenotype. Gene knockdowns were performed with control or dsRNAs targeting coding region of seipin. Cells were then co-transfected with cherry-LiveDrop (red) and human seipin (green). Cells were treated with oleic acid for 30 min before imaging. Arrows, BODIPY-positive LDs; arrowheads, BODIPY-negative LiveDrop puncta. Bars, 5 μm. Quantification of cells with abnormal accumulations of BODIPY negative LiveDrop puncta are shown in (D). Representative results from two independent experiments are shown. 40 cells from each condition were quantified. DOI: http://dx.doi.org/10.7554/eLife.16582.016
Figure 5.
Figure 5.. Seipin-deficient cells accumulate nascent LDs that are close to the ER.
(A) Control and seipin knockout SUM159 cells were fixed, embedded, and stained with uranyl acetate and lead citrate. Thin sections were imaged with transmission electron microscopy. Arrows, mature iLDs; arrowheads, nascent LDs. Close-up images (bottom row) are from different cell areas, representing different levels of proximity to the ER. Bars, 0.5 μm (top) and 0.2 μm (bottom). (B) Quantification of number and size of LDs in control and seipin-knockout SUM159 cells. Total of 15 areas from each phenotype were quantified. ***p<0.0001. (C) Electron tomography of a nascent LD in the seipin-knockout SUM159 cell. Thick sections of cells were imaged and reconstituted with IMOD. Serial sections from one example are shown. Numbers on top represent the relative position. Arrows, membrane contact zone; arrowheads, possible filamentous structures between nascent LDs and the ER. Bar, 0.2 μm. (D) Modeling of electron tomograms. Green, ER; blue, nascent LDs; orange, ribosomes; yellow, possible filamentous structure between nascent LDs and the ER. Rendering was performed with IMOD software. Movies of the tomograms are shown in Video 11. DOI: http://dx.doi.org/10.7554/eLife.16582.017
Figure 5—figure supplement 1.
Figure 5—figure supplement 1.. Seipin-deficient cells accumulate small, nascent LDs that are close to the ER.
(A) Thin-section TEM images of human fibroblasts from control and lipodystrophy patients with seipin loss-of-function mutations. Arrows, mature iLDs; arrowheads, nascent LDs. Close-up images (bottom row) are from different cell areas, representing different levels of proximity to the ER. Bars, 0.5 μm (top) and 0.2 μm (bottom). (B) Thin-section TEM images of control and seipin knockdown Drosophila S2 cells. Note the presence of pre-existing larger LDs (white arrows) along with the smaller nascent LDs (arrowheads) in seipin knockdown. Bars, 0.5 μm (top) and 0.2 μm (bottom). (C) A gallery of small, nascent LDs in the proximity of the ER, generated from additional dual-axis (a-c) or single-axis (d-f) electron tomograms of SUM159 seipin knockout cells. The original tomograms are shown in Videos 8, 9 and 10. DOI: http://dx.doi.org/10.7554/eLife.16582.018
Figure 6.
Figure 6.. Endogenous seipin forms discrete, mobile foci in the ER that co-localize with initial LDs during formation in Drosophila S2 cells.
(A) Endogenous seipin was tagged with GFP at the N-terminus (crGFP-seipin, green) by CRISPR/Cas9 genome editing. Cells were transfected with BFP-KDEL (red), and movies were captured with live-cell microscopy at 0.31 s frame intervals in the absence of oleic acid. The first frame is shown. Bar, 5 μm. (B) Seipin forms discrete foci that are highly mobile along the ER. Movement of GFP-seipin foci from movies taken in (A) was tracked with FIJI software. Total distance and average velocity were calculated. n= 3 cells, 8 foci per cell. (C) Seipin foci become co-localized with LiveDrop puncta to form nascent growing LDs. crGFP-seipin cells expressing cherry-LiveDrop were incubated with oleic acid for 5 min before live-cell images were taken (~2.05 s frame interval) for 2 min. Images were de-convolved as described in Methods. Top: image of a whole cell at indicated time point; inlay: magnification of boxed area; arrowhead: an event where a LiveDrop punctum becomes associated with seipin and grows. A time series of this event is magnified under the image. Bottom: two more examples of similar events in other cells. Green, GFP-seipin; red, cherry-LiveDrop. Bar, 5 μm. (D) Seipin foci associated with LDs become less mobile. crGFP-seipin cells expressing cherry-LiveDrop were treated with oleic acid for 30 min. Live-cell images were taken at max speed (~0.27 s frame interval) for 30 s, and the movement of seipin foci that are associated (arrowheads) or not associated (arrows) with LDs were traced and analyzed with FIJI. Representative tracks overlaid on image are shown (middle). Total distance and average velocity were calculated (bottom). n= 3 cells, 6 puncta per cell. Bar, 5 μm. **p<0.005. (E) The majority of formed LDs are associated with seipin foci. crGFP-seipin cells were treated with oleic acid for 3 hr, and LDs were stained with LipidTox (red). Images were taken as Z stacks, and middle slices are shown. Number of LDs with or without a seipin focus within a cell was quantified. Bar, 5 μm. n=10 cells. DOI: http://dx.doi.org/10.7554/eLife.16582.024
Figure 6—figure supplement 1.
Figure 6—figure supplement 1.. Seipin foci are localized in the ER but not at specific ER domains.
(A) crGFP-seipin (green) cells expressing BFP-KDEL (red) were imaged as described in Figure 3A. A montage of frames is show. Seipin can be found at tubules (e.g., 9.98 and 10.56 s), junctions (e.g., 3.69 and 7.56 s), and tips (e.g., 0.00 and 2.50 s). Arrowhead follows the movement of a single seipin focus overtime. (B) crGFP-seipin does not specifically localize at three-way junctions of the ER. crGFP-seipin cell line expressing cherry-lunapark, a marker for ER three-way junction, and BFP-KDEL, an ER marker, were imaged without fixation. crGFP-seipin does not colocalize with lunapark. DOI: http://dx.doi.org/10.7554/eLife.16582.025
Figure 7.
Figure 7.. Aberrant LD formation in seipin deficiency increases the expanding LD population in Drosophila S2 cells.
(A, B) Earlier and increased GPAT4 targeting to initial LDs with seipin depletion. Control or seipin knockdown cells were incubated with oleic acid for indicated times. Targeting of endogenous GPAT4 to LDs during early (A) or late (B) stage of LD formation were determined by immunofluorescence. Images are presented as projected Z stacks (A), or single optical slices (B). Red, GPAT4; green, LDs, stained with BODIPY. Bars, 5 μm for (A) and 10 μm for (B). Note that GPAT4 targeting to LDs takes place as early as 10 min after adding oleic acid in seipin knockdown. (C) Quantification of GPAT4-positive LDs at 20 min and 8 hr after adding oleic acid. n=30 cells. ***p<0.001. (D) The formation of giant LDs in seipin deficiency depends on LD-localized TG enzymes. Expression of TG synthesis enzymes that are localized to LDs (LD-isoforms) or elsewhere (Non-LD isoforms) were inhibited with specific dsRNAs in combination with control dsRNA or dsRNA against seipin. LD phenotypes were determined 16 hr after LD formation was induced with oleic acid. Bar, 10 μm. Quantification of LD size from 10 cells in each treatment is shown. Lines show mean values. Yellow box indicates giant LDs of diameter > 2.5 μm. DOI: http://dx.doi.org/10.7554/eLife.16582.028
Figure 8.
Figure 8.. Seipin deficiency affects phospholipid composition on LDs at later stages of formation in Drosophila S2 cells.
(A) Phospholipids are deficient on LDs in seipin-knockdown cells 8 hr after initiating formation. Control or seipin knockdown cells were pulse-labeled with [14C]-oleic acid (100 μCi/μmol) for indicated times. LD fractions were purified by gradient centrifugation, and phospholipids and neutral lipids were extracted and separated by TLC. The TLC plate was exposed on an imaging screen, and the intensity of bands was quantified with FIJI. Values are integrated density normalized to protein concentration or ratio of integrated density of indicated lipid classes. n=3. **p<0.005; ***p<0.001 (B) Targeting of CCT1 to LDs is increased and earlier with seipin depletion. Control or seipin-knockdown cells were incubated with oleic acid for 1, 3, or 8 hr, and localization of endogenous CCT1 was determined by immunofluorescence. Image shows a typical result at 8 hr. Red, CCT1; green, BODIPY. Bar, 5 μm. Targeting of CCT1 to LDs was quantified and is expressed as percentage of CCT1 signal on LDs over total cellular CCT1 signal. Data are presented as box plot with Tukey’s test. n=20. *p<0.05; **p<0.01; ***p<0.001. (C) Giant LD phenotype in seipin deficiency is rescued by adding PC or choline. Control, seipin, or CCT1 knockdown cells were treated with liposomes containing PC, PE or choline for 24 hr and then incubated with oleic acid for 16 hr. LD phenotype from representative cells are shown. Bar, 10 μm. Quantification of LD size from 10 cells in each treatment is shown. Lines show mean values. Yellow box indicates giant LDs of diameter > 2.5 μm. (D) Giant LD phenotype in seipin deficiency is worsened by blocking PC synthesis and ameliorated by blocking PE synthesis. Expression of CCT1 or ECT was inhibited by respective dsRNAs, in addition to control or seipin dsRNAs. Representative LD phenotypes after 16 hr of oleic acid treatment are shown. Bar, 5 μm. Quantification of LD size from 10 cells in each treatment is shown. Lines show mean values. Yellow box indicates giant LDs of diameter > 2.5 μm. DOI: http://dx.doi.org/10.7554/eLife.16582.029
Figure 9.
Figure 9.. Model for the role of seipin in LD formation.
Seipin oligomers localize at the contact sites between nascent iLDs and the ER, enabling transfer of lipids (such as TG) to the nascent LDs to convert nascent iLD of <200 nm diameter to mature iLD of 300–500 nm diameter. Without seipin, lipid transfer is inhibited, and LD growth is arrested, leading to the accumulation of nascent iLDs. The maintenance of the contact site between nascent iLDs and the ER does not require seipin; an unknown protein is likely to be involved. DOI: http://dx.doi.org/10.7554/eLife.16582.030

References

    1. Agarwal AK, Garg A. Seipin: a mysterious protein. Trends in Molecular Medicine. 2004;10:440–444. doi: 10.1016/j.molmed.2004.07.009. - DOI - PubMed
    1. Agarwal AK, Simha V, Oral EA, Moran SA, Gorden P, O'Rahilly S, Zaidi Z, Gurakan F, Arslanian SA, Klar A, Ricker A, White NH, Bindl L, Herbst K, Kennel K, Patel SB, Al-Gazali L, Garg A. Phenotypic and genetic heterogeneity in congenital generalized lipodystrophy. The Journal of Clinical Endocrinology & Metabolism. 2003;88:4840–4847. doi: 10.1210/jc.2003-030855. - DOI - PubMed
    1. Almeida R, Pauling JK, Sokol E, Hannibal-Bach HK, Ejsing CS. Comprehensive lipidome analysis by shotgun lipidomics on a hybrid quadrupole-orbitrap-linear ion trap mass spectrometer. Journal of the American Society for Mass Spectrometry. 2015;26:133–148. doi: 10.1007/s13361-014-1013-x. - DOI - PubMed
    1. Bi J, Wang W, Liu Z, Huang X, Jiang Q, Liu G, Wang Y, Huang X. Seipin promotes adipose tissue fat storage through the ER Ca²⁺-ATPase SERCA. Cell Metabolism. 2014;19:861–871. doi: 10.1016/j.cmet.2014.03.028. - DOI - PubMed
    1. Binns D, Lee S, Hilton CL, Jiang QX, Goodman JM. Seipin is a discrete homooligomer. Biochemistry. 2010;49:10747–10755. doi: 10.1021/bi1013003. - DOI - PMC - PubMed