

Maize susceptibility to Ustilago maydis is influenced by genetic and chemical perturbation of carbohydrate allocation
- PMID: 27564861
- PMCID: PMC6638311
- DOI: 10.1111/mpp.12486
Maize susceptibility to Ustilago maydis is influenced by genetic and chemical perturbation of carbohydrate allocation
Abstract
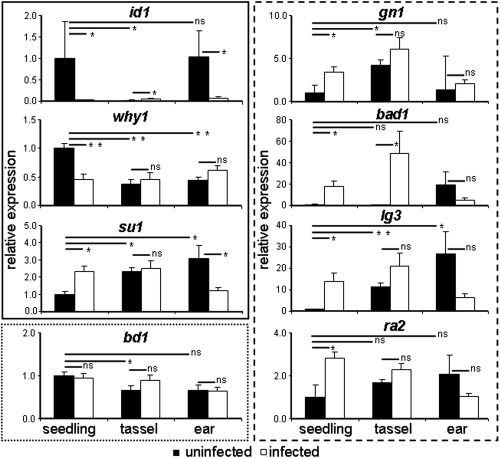
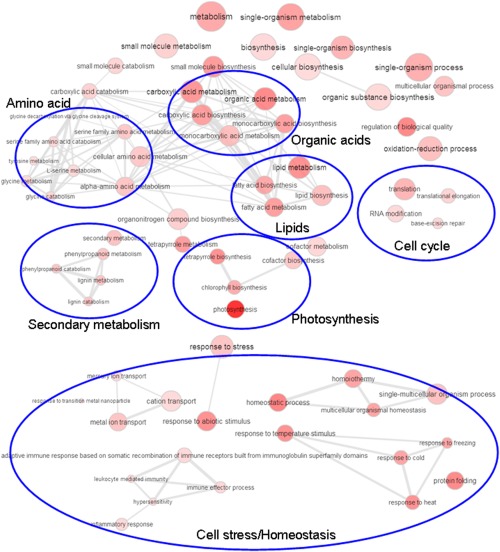
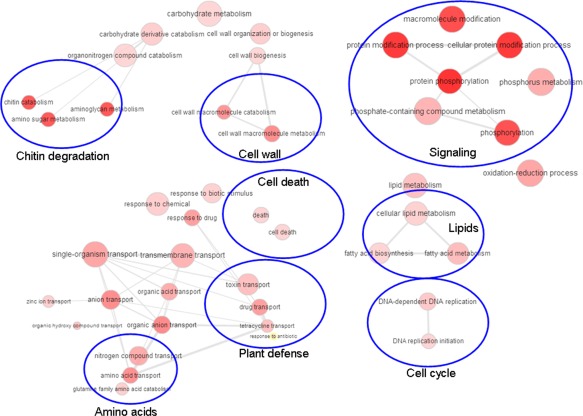
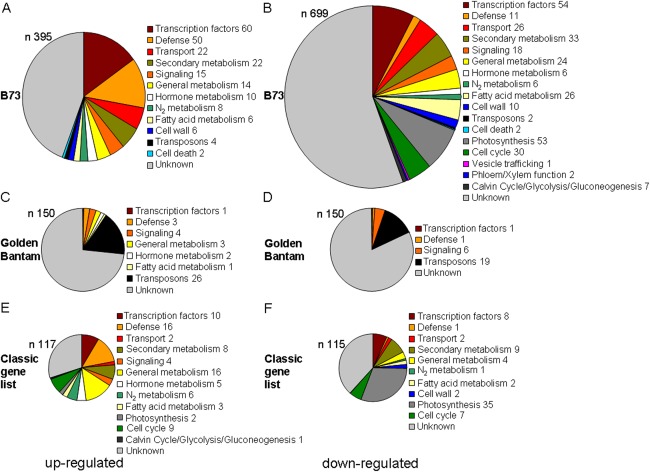
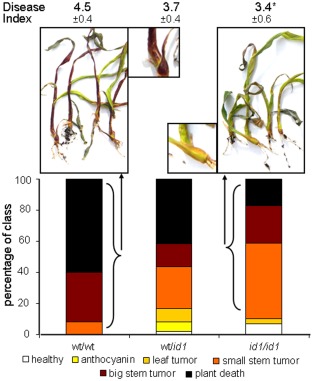
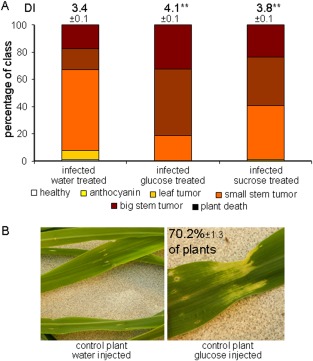
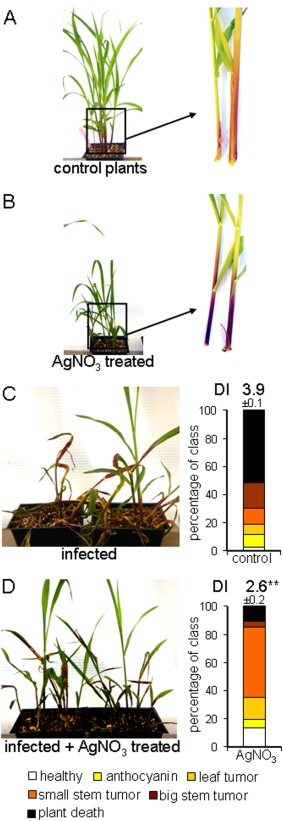
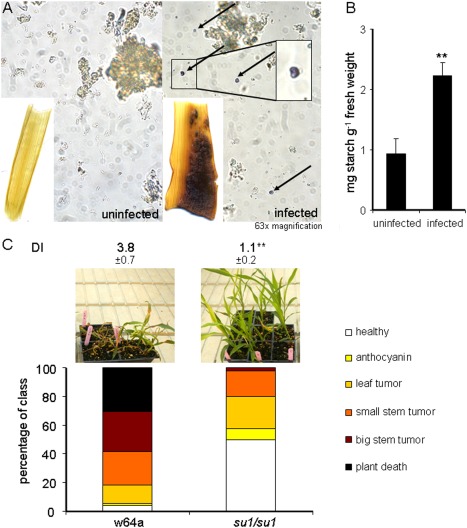
The ability of biotrophic fungi to metabolically adapt to the host environment is a critical factor in fungal diseases of crop plants. In this study, we analysed the transcriptome of maize tumours induced by Ustilago maydis to identify key features underlying metabolic shifts during disease. Among other metabolic changes, this analysis highlighted modifications during infection in the transcriptional regulation of carbohydrate allocation and starch metabolism. We confirmed the relevance of these changes by establishing that symptom development was altered in an id1 (indeterminate1) mutant that showed increased accumulation of sucrose as well as being defective in the vegetative to reproductive transition. We further established the relevance of specific metabolic functions related to carbohydrate allocation by assaying disease in su1 (sugary1) mutant plants with altered starch metabolism and in plants treated with glucose, sucrose and silver nitrate during infection. We propose that specific regulatory and metabolic changes influence the balance between susceptibility and resistance by altering carbon allocation to promote fungal growth or to influence plant defence. Taken together, these studies reveal key aspects of metabolism that are critical for biotrophic adaptation during the maize-U. maydis interaction.
Keywords: RNA-Seq; Zea mays; maize; smut; starch; transcription factor.
© 2016 BSPP AND JOHN WILEY & SONS LTD.
Figures
Similar articles
-
Chloroplast-associated metabolic functions influence the susceptibility of maize to Ustilago maydis.Mol Plant Pathol. 2017 Dec;18(9):1210-1221. doi: 10.1111/mpp.12485. Epub 2016 Nov 14. Mol Plant Pathol. 2017. PMID: 27564650 Free PMC article.
-
Reprogramming a maize plant: transcriptional and metabolic changes induced by the fungal biotroph Ustilago maydis.Plant J. 2008 Oct;56(2):181-195. doi: 10.1111/j.1365-313X.2008.03590.x. Epub 2008 Jun 28. Plant J. 2008. PMID: 18564380
-
Dissecting defense-related and developmental transcriptional responses of maize during Ustilago maydis infection and subsequent tumor formation.Plant Physiol. 2005 Jul;138(3):1774-84. doi: 10.1104/pp.105.061200. Epub 2005 Jun 24. Plant Physiol. 2005. PMID: 15980197 Free PMC article.
-
Transcripts and tumors: regulatory and metabolic programming during biotrophic phytopathogenesis.F1000Res. 2018 Nov 19;7:F1000 Faculty Rev-1812. doi: 10.12688/f1000research.16404.1. eCollection 2018. F1000Res. 2018. PMID: 30519451 Free PMC article. Review.
-
Ustilago maydis as a Pathogen.Annu Rev Phytopathol. 2009;47:423-45. doi: 10.1146/annurev-phyto-080508-081923. Annu Rev Phytopathol. 2009. PMID: 19400641 Review.
Cited by
-
Sugar Transporters in Plasmodiophora brassicae: Genome-Wide Identification and Functional Verification.Int J Mol Sci. 2022 May 9;23(9):5264. doi: 10.3390/ijms23095264. Int J Mol Sci. 2022. PMID: 35563657 Free PMC article.
-
Insights into Host Cell Modulation and Induction of New Cells by the Corn Smut Ustilago maydis.Front Plant Sci. 2017 May 29;8:899. doi: 10.3389/fpls.2017.00899. eCollection 2017. Front Plant Sci. 2017. PMID: 28611813 Free PMC article. Review.
-
The Monothiol Glutaredoxin Grx4 Influences Iron Homeostasis and Virulence in Ustilago maydis.J Fungi (Basel). 2023 Nov 17;9(11):1112. doi: 10.3390/jof9111112. J Fungi (Basel). 2023. PMID: 37998917 Free PMC article.
-
Establishing an itaconic acid production process with Ustilago species on the low-cost substrate starch.FEMS Yeast Res. 2024 Jan 9;24:foae023. doi: 10.1093/femsyr/foae023. FEMS Yeast Res. 2024. PMID: 39038994 Free PMC article.
-
Chloroplasts and Plant Immunity: Where Are the Fungal Effectors?Pathogens. 2019 Dec 24;9(1):19. doi: 10.3390/pathogens9010019. Pathogens. 2019. PMID: 31878153 Free PMC article. Review.
References
-
- Basse, C.W. and Steinberg, G. (2004) Ustilago maydis, model system for analysis of the molecular basis of fungal pathogenicity. Mol. Plant Pathol. 5, 83–92. - PubMed
Publication types
MeSH terms
Substances
LinkOut - more resources
Full Text Sources
Other Literature Sources
