

Pharyngeal Pressure and Timing During Bolus Transit
- PMID: 27565155
- PMCID: PMC5832365
- DOI: 10.1007/s00455-016-9743-5
Pharyngeal Pressure and Timing During Bolus Transit
Abstract
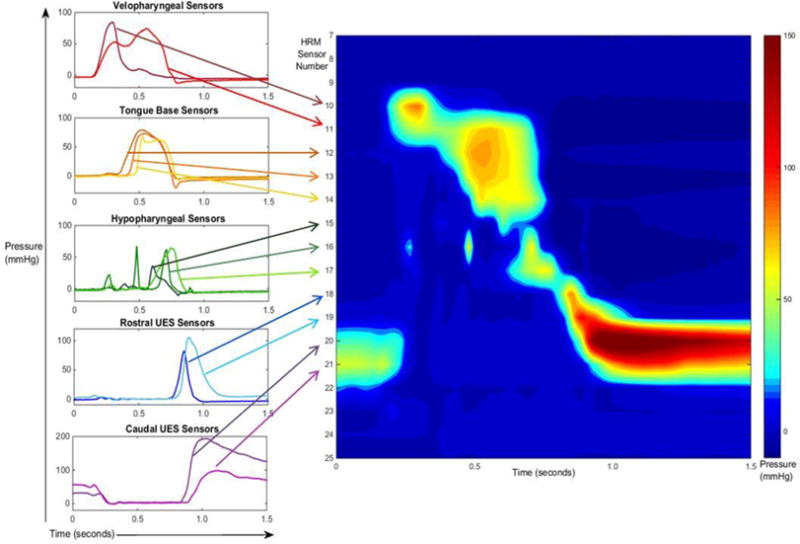
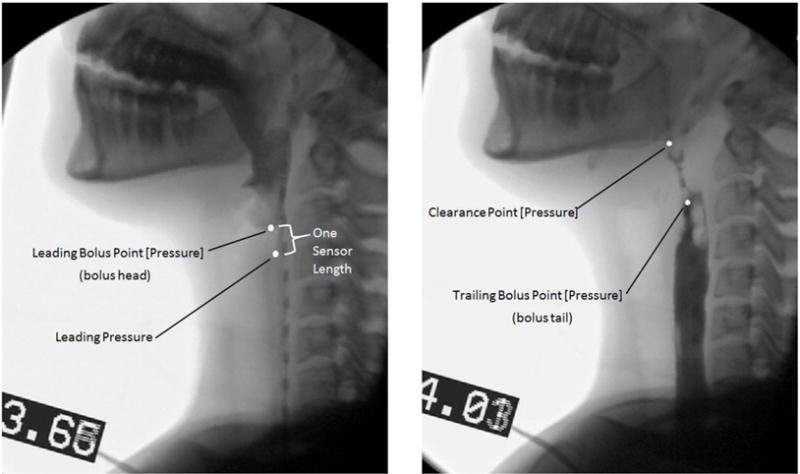
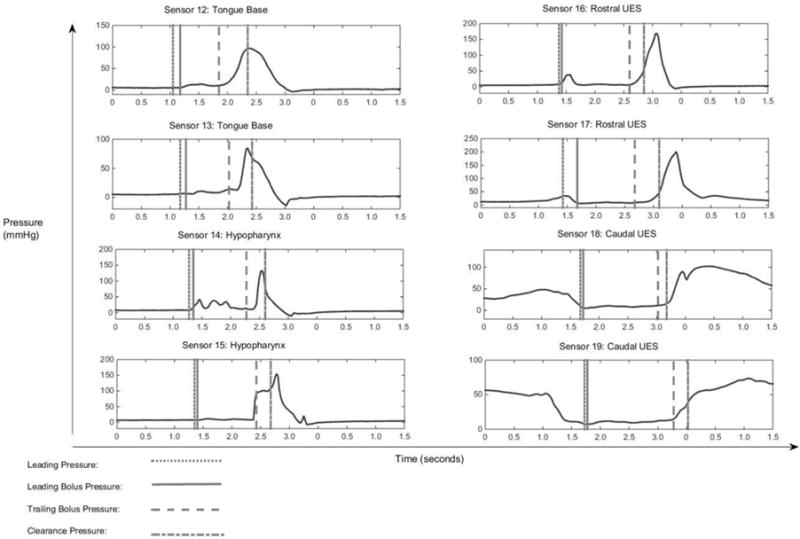
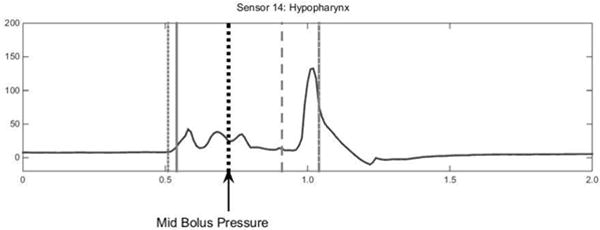
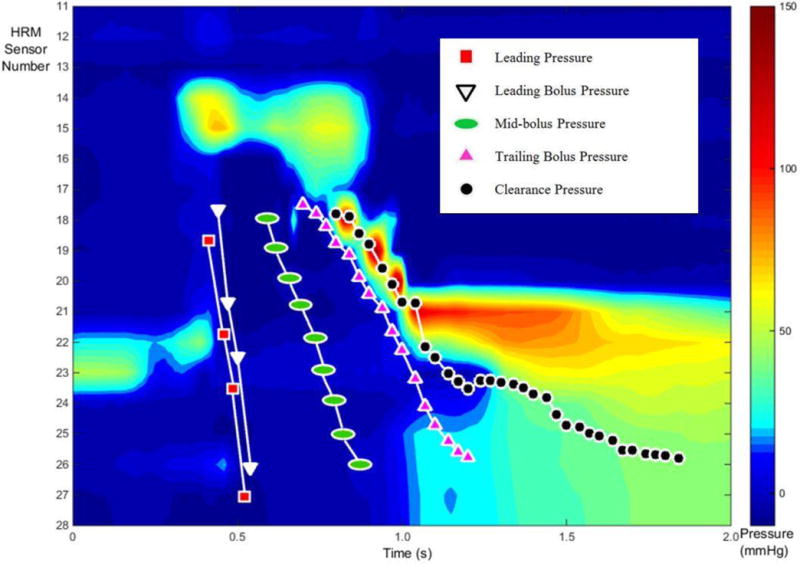
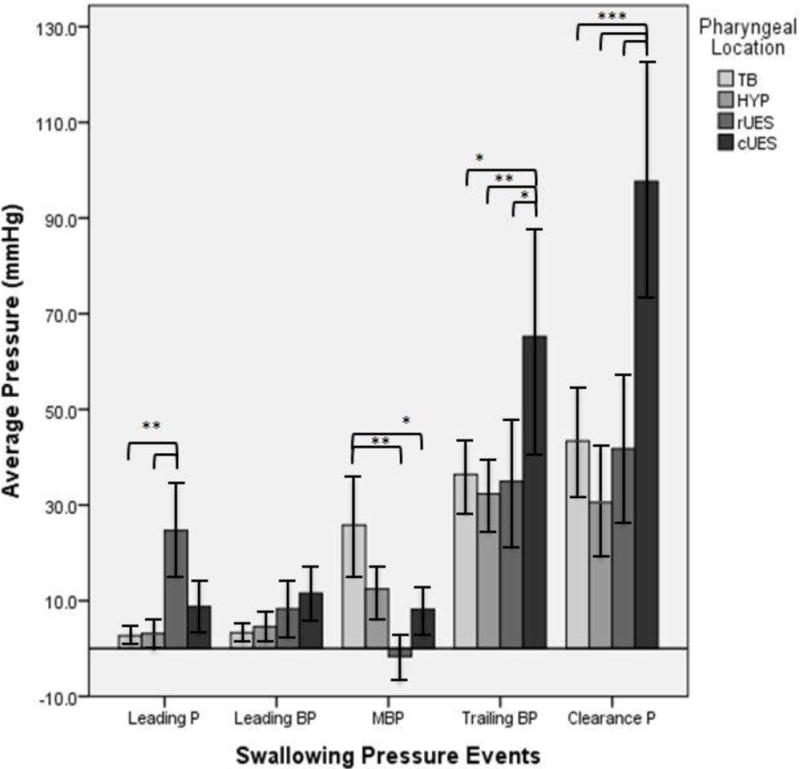
Determining intrabolus pressure (IBP) at the upper esophageal sphincter (UES) and in the esophagus has given compelling evidence that IBP can be a predictor for swallowing dysfunction. Studies have looked most superiorly at the low hypopharynx region but there has been no inquiry into what IBP measures throughout the entire pharynx can tell us. We present a study to describe the pressures within and surrounding the moving bolus throughout the pharynx and into the UES. Simultaneous high-resolution manometry (HRM) and videofluoroscopy were performed in ten healthy subjects swallowing ten 10 mL thin-liquid barium boluses. Three events surrounding bolus movement were tracked via videofluoroscopy, and two additional events were found using manometric measures. As the bolus passes through the pharynx, low pressure is created at and below the head of the bolus. A modest pressure increase is seen as the bolus passes through the pharynx, and finally, high pressure is observed at the bolus tail, followed by an even larger pressure generation of a clearance event. HRM allows for greater resolution in data collection in the pharynx and in this study, aided in identifying semi-unique characteristics around the hypopharynx and the UES which are consistent with the complex anatomy of the regions and the transition of the UES from active closure to relaxed opening. In the future, additional studies designed to look at aged and diseased populations may lead to better understanding of disease etiology, and treatment options.
Keywords: Deglutition; Deglutition disorders; High-resolution manometry; Intrabolus Pressure; Videofluoroscopy.
Conflict of interest statement
Conflict of Interest: Authors have no conflict of interest to declare.
Figures
References
-
- Massey BT. Physiology of oral cavity, pharynx and upper esophageal sphincter. GI Motility online. 2006
-
- McConnel FM. Analysis of pressure generation and bolus transit during pharyngeal swallowing. Laryngoscope. 1988;98:71–78. - PubMed
-
- Mcconnel FMHD, Jackson K, O’Connorn A. Analysis of intrabolus forces in patients with zenker’s diverticulum. The Laryngoscope. 1994;104:571–581. - PubMed
-
- Ali GN, Wallace KL, Laundl TM, Hunt DR, deCarle DJ, Cook IJ. Predictors of outcome following cricopharyngeal disruption for pharyngeal dysphagia. Dysphagia. 1997;12:133–139. - PubMed
-
- Colizzo JM, Clayton SB, Richter JE. Intrabolus pressure on high-resolution manometry distinguishes fibrostenotic and inflammatory phenotypes of eosinophilic esophagitis. Diseases of the Esophagus. 2015 - PubMed
Publication types
MeSH terms
Grants and funding
LinkOut - more resources
Full Text Sources
Other Literature Sources
Research Materials
