

Toward Accurate and Quantitative Comparative Metagenomics
- PMID: 27565341
- PMCID: PMC5080976
- DOI: 10.1016/j.cell.2016.08.007
Toward Accurate and Quantitative Comparative Metagenomics
Abstract
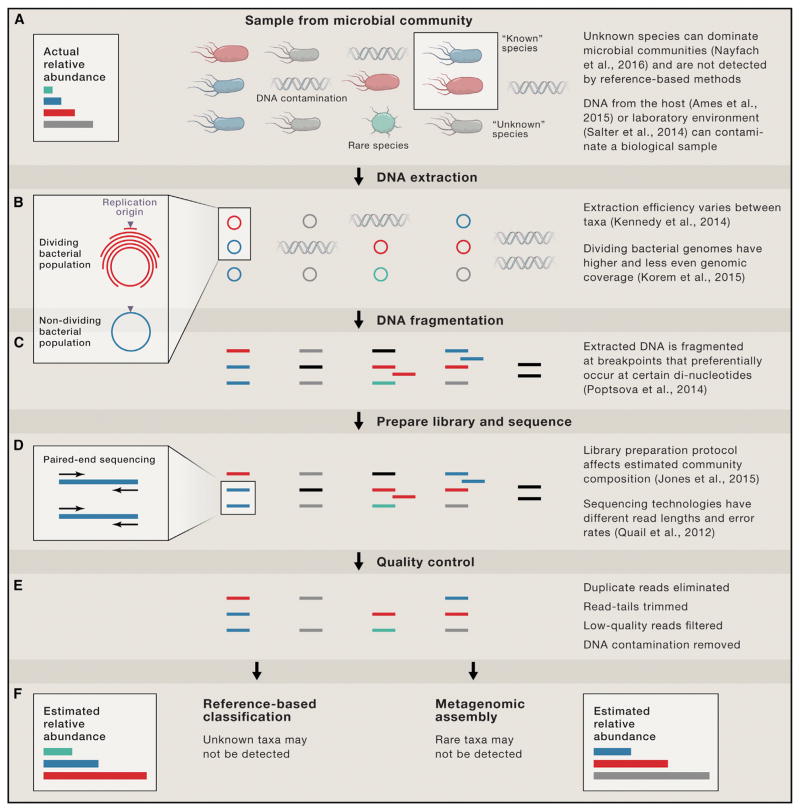
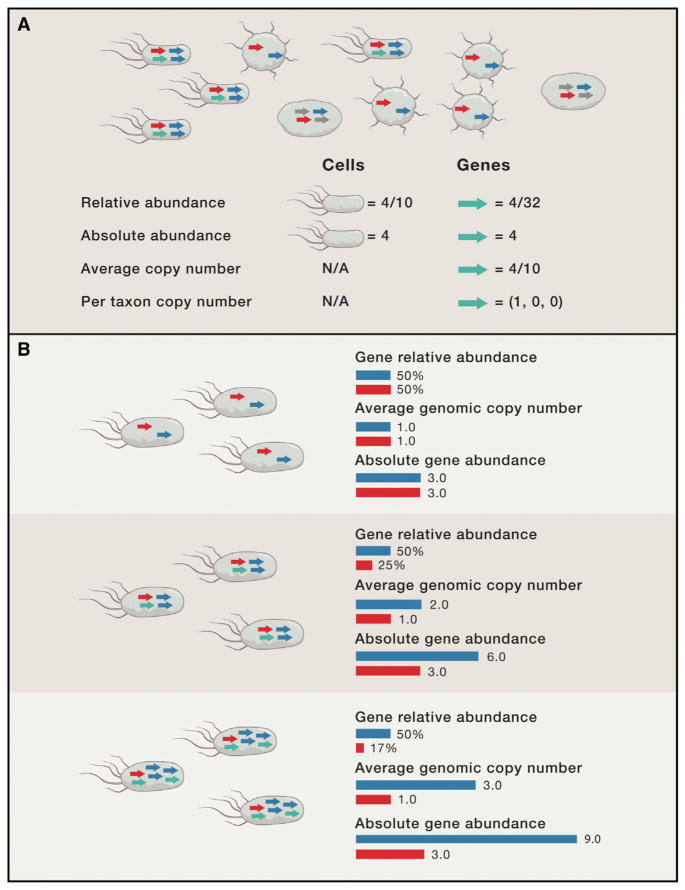
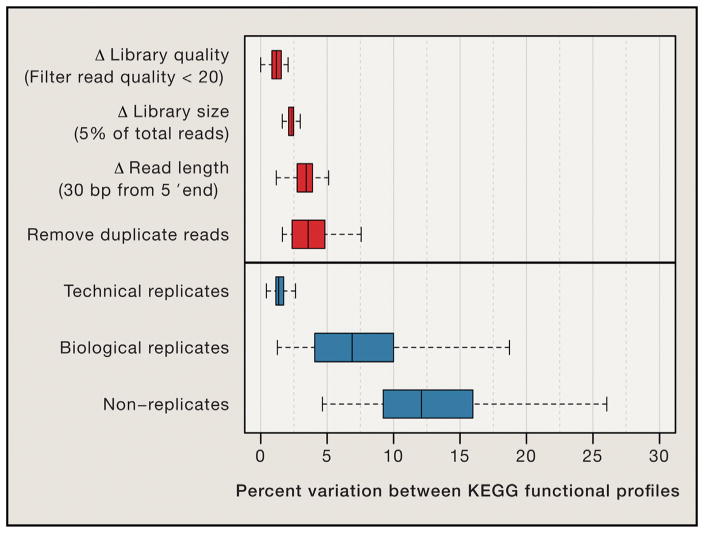
Shotgun metagenomics and computational analysis are used to compare the taxonomic and functional profiles of microbial communities. Leveraging this approach to understand roles of microbes in human biology and other environments requires quantitative data summaries whose values are comparable across samples and studies. Comparability is currently hampered by the use of abundance statistics that do not estimate a meaningful parameter of the microbial community and biases introduced by experimental protocols and data-cleaning approaches. Addressing these challenges, along with improving study design, data access, metadata standardization, and analysis tools, will enable accurate comparative metagenomics. We envision a future in which microbiome studies are replicable and new metagenomes are easily and rapidly integrated with existing data. Only then can the potential of metagenomics for predictive ecological modeling, well-powered association studies, and effective microbiome medicine be fully realized.
Copyright © 2016 Elsevier Inc. All rights reserved.
Figures
Similar articles
-
Community-analyzer: a platform for visualizing and comparing microbial community structure across microbiomes.Genomics. 2013 Oct;102(4):409-18. doi: 10.1016/j.ygeno.2013.08.004. Epub 2013 Aug 24. Genomics. 2013. PMID: 23978768
-
What Is Metagenomics Teaching Us, and What Is Missed?Annu Rev Microbiol. 2020 Sep 8;74:117-135. doi: 10.1146/annurev-micro-012520-072314. Epub 2020 Jun 30. Annu Rev Microbiol. 2020. PMID: 32603623 Review.
-
Metagenomics methods for the study of plant-associated microbial communities: A review.J Microbiol Methods. 2020 Mar;170:105860. doi: 10.1016/j.mimet.2020.105860. Epub 2020 Feb 4. J Microbiol Methods. 2020. PMID: 32027927 Review.
-
Average genome size estimation improves comparative metagenomics and sheds light on the functional ecology of the human microbiome.Genome Biol. 2015 Mar 25;16(1):51. doi: 10.1186/s13059-015-0611-7. Genome Biol. 2015. PMID: 25853934 Free PMC article.
-
An Introduction to Whole-Metagenome Shotgun Sequencing Studies.Methods Mol Biol. 2021;2243:107-122. doi: 10.1007/978-1-0716-1103-6_6. Methods Mol Biol. 2021. PMID: 33606255 Review.
Cited by
-
AsgeneDB: a curated orthology arsenic metabolism gene database and computational tool for metagenome annotation.NAR Genom Bioinform. 2022 Nov 1;4(4):lqac080. doi: 10.1093/nargab/lqac080. eCollection 2022 Dec. NAR Genom Bioinform. 2022. PMID: 36330044 Free PMC article.
-
Emergent Functional Organization of Gut Microbiomes in Health and Diseases.Biomolecules. 2023 Dec 20;14(1):5. doi: 10.3390/biom14010005. Biomolecules. 2023. PMID: 38275746 Free PMC article.
-
Synthetic microbe communities provide internal reference standards for metagenome sequencing and analysis.Nat Commun. 2018 Aug 6;9(1):3096. doi: 10.1038/s41467-018-05555-0. Nat Commun. 2018. PMID: 30082706 Free PMC article.
-
Crewmember microbiome may influence microbial composition of ISS habitable surfaces.PLoS One. 2020 Apr 29;15(4):e0231838. doi: 10.1371/journal.pone.0231838. eCollection 2020. PLoS One. 2020. PMID: 32348348 Free PMC article.
-
An Expanded Gene Catalog of Mouse Gut Metagenomes.mSphere. 2021 Feb 24;6(1):e01119-20. doi: 10.1128/mSphere.01119-20. mSphere. 2021. PMID: 33627510 Free PMC article.
References
-
- Aitchison J. The Statistical Analysis of Compositional Data. Caldwell, N.J: Blackburn Press; 2003.
-
- Alivisatos AP, Blaser MJ, Brodie EL, Chun M, Dangl JL, Donohue TJ, Dorrestein PC, Gilbert JA, Green JL, Jansson JK, et al. MICROBIOME. A unified initiative to harness Earth’s microbiomes. Science. 2015;350:507–508. - PubMed
-
- Alneberg J, Bjarnason BS, de Bruijn I, Schirmer M, Quick J, Ijaz UZ, Lahti L, Loman NJ, Andersson AF, Quince C. Binning meta-genomic contigs by coverage and composition. Nat Methods. 2014;11:1144–1146. - PubMed
Publication types
MeSH terms
Grants and funding
LinkOut - more resources
Full Text Sources
Other Literature Sources
