. 2016 Aug 25;166(5):1132-1146.e7.
doi: 10.1016/j.cell.2016.07.045.

Multi-organ Mapping of Cancer Risk

Affiliations

Multi-organ Mapping of Cancer Risk

Liqin Zhu et al. Cell. .

Abstract

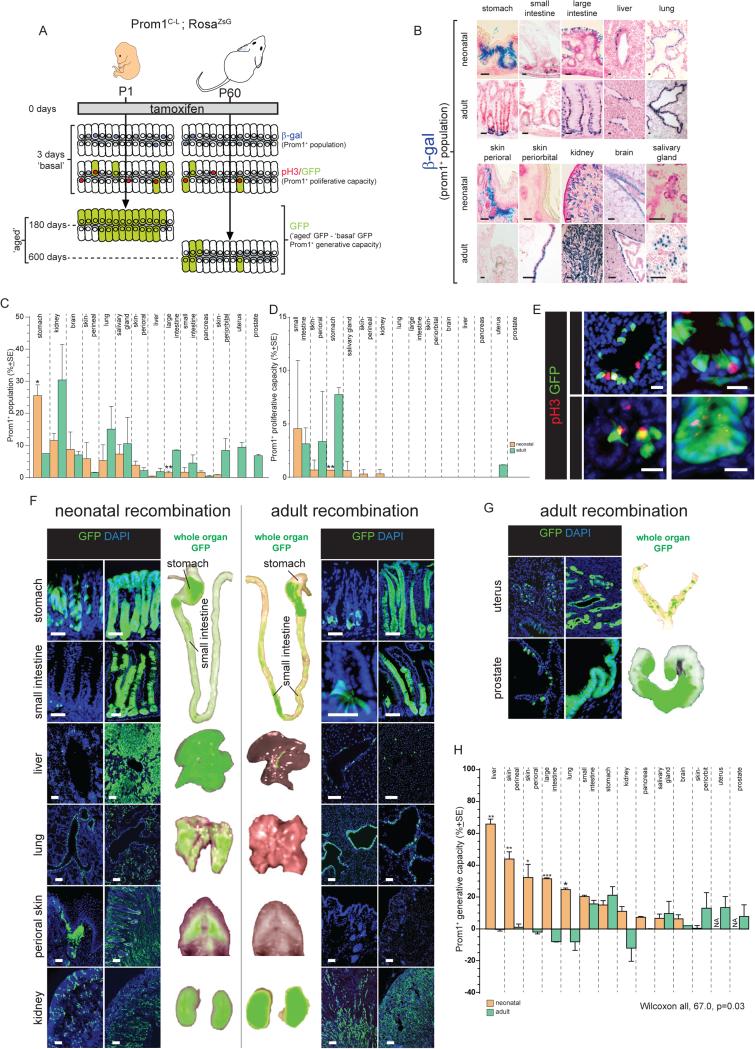
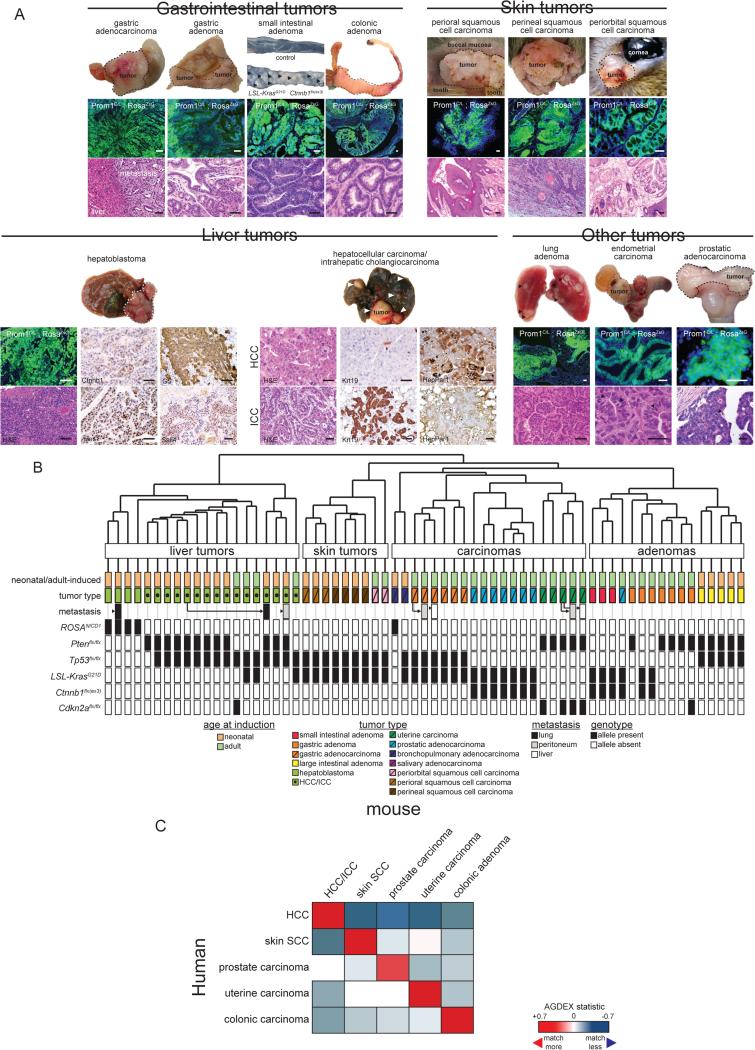
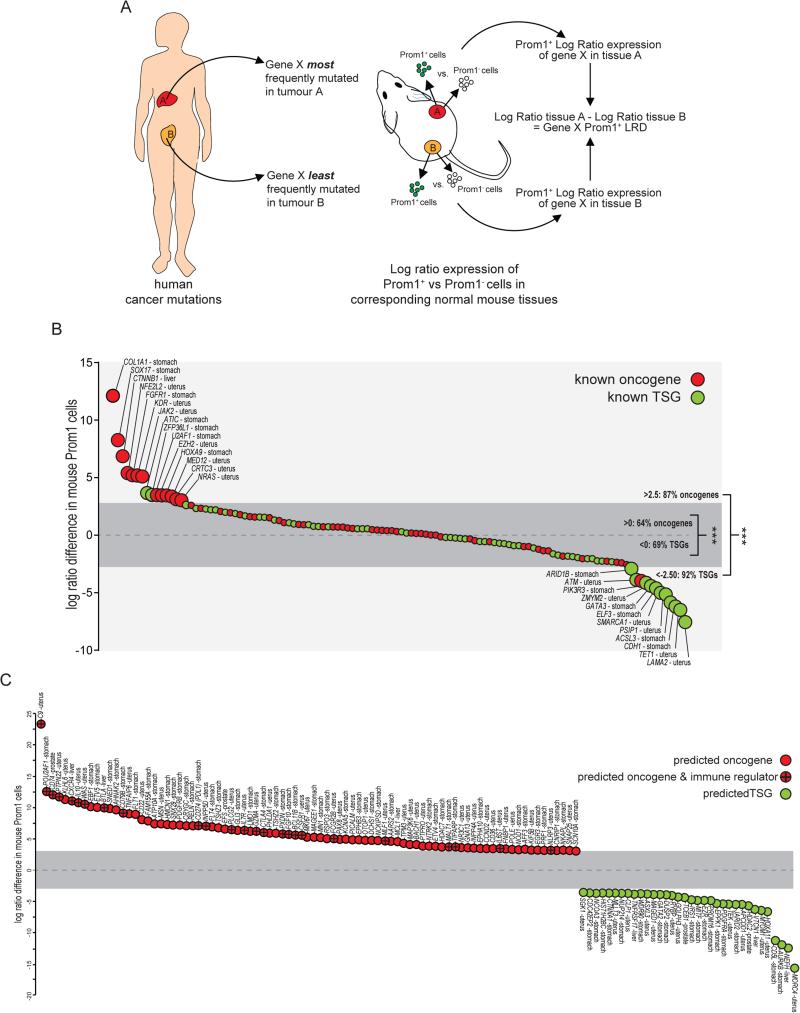
Cancers are distributed unevenly across the body, but the importance of cell intrinsic factors such as stem cell function in determining organ cancer risk is unknown. Therefore, we used Cre-recombination of conditional lineage tracing, oncogene, and tumor suppressor alleles to define populations of stem and non-stem cells in mouse organs and test their life-long susceptibility to tumorigenesis. We show that tumor incidence is determined by the life-long generative capacity of mutated cells. This relationship held true in the presence of multiple genotypes and regardless of developmental stage, strongly supporting the notion that stem cells dictate organ cancer risk. Using the liver as a model system, we further show that damage-induced activation of stem cell function markedly increases cancer risk. Therefore, we propose that a combination of stem cell mutagenesis and extrinsic factors that enhance the proliferation of these cell populations, creates a "perfect storm" that ultimately determines organ cancer risk. VIDEO ABSTRACT.


Figures

Figure 1
Figure 1. Prom1+ cell properties in major organs of Prom1C-L; RosaZsG mice
A. Overall approach used the measure Prom1+ cell number, proliferative and generative capacities across organs of neonatal and adult mice. B. β-galactosidase staining of Prom1+ cells in neonatal and adult Prom1C-L mouse tissues (top panels scale bars=10μm; bottom=50μm). Percentage of Prom1+ cells (C) and percentage of proliferating Prom1+ cells (D) in indicated tissues. (E) Arrows identify proliferating Prom1+ cells in indicated tissues 1 day post tamoxifen (scale bars=10μm). (F,G) Direct GFP fluorescence microscopy of tissues at the indicated times post tamoxifen treatment. Whole organ direct GFP fluorescence images are also shown (scale bars=50μm). (E) Prom1+ cell generative capacity in indicated tissues. (*, p<0.05; **, p<0.005; ***, p<0.0005. See also Figures S1-S3 and Table S1. Data in C, D and H represent mean ±SE.
Figure 2
Figure 2. Prom1+ cell susceptibility to tumourigenesis in major organs of Prom1C-L; RosaZsG mice
A. Overall approach used to measure Prom1+ cell susceptibility to tumourigenesis. B. Left, survival curves of neonatal and adult Prom1C-L ; RosaZsG mice carrying the indicated alleles. P-value=difference in adult and neonatal survival. Right, pie charts of numbers of mice autopsied containing no, single or multiple tumours. C. Incidence of tumours in the indicated tissues across all genotypes. D. Anatomical heatmaps of organ tumour incidence. Below, ratios of tumours in neonatal and adult tissues. F=Fishers test of the difference; MHC= Mantel-Haenstzel-Cochran test of the difference. See also Table S2.
Figure 3
Figure 3. Histology and transcriptomic analysis of Prom1+ cell derived tumours in mice
A. Top: gross specimens (arrows and dotted lines denote tumours), and photomicrographs of direct GFP fluorescence, liver immunohistochemistry (HCC and hepatoblastoma marker expression) and H&E stains (arrows denote mitoses) of exemplary tumours (scale bars=50μm). B. Unsupervised hierarchical clustering of mouse tumours. Details of age at recombination, tumour histology and genotype are shown below. C. AGDEX comparison of histologically matched human and mouse tumours. See also Tables S3 and S4.
Figure 4
Figure 4. Relationship of Prom1+ cell characteristics to tumour susceptibility
Generalised linear mixed models with a logit link (GLMM-LL) of tumour probability vs. Prom1+ cell generative capacity (A), Prom1+ cell population size (B), and Prom1+ cell proliferative capacity (C). Numbers at top of each graph indicate the regression coefficients and p-value of each as well as the Akaike Information Criterion score. D. GLMM-LL iterative multivariable modeling of tumour probability vs. Prom1+ cell generative and proliferative capacities in adult (D) and neonatal (E) tissues. See also Methods and Resources.
Figure 5
Figure 5. Stem cell activity and tumour susceptibility are functionally related in Prom1+ liver cells
A. Concurrent β-galactosidase and direct GFP fluorescence of the same section of liver taken from an adult Prom1C-L ; RosaZsG mouse that underwent tamoxifen-recombination as a neonate. Arrows identify β-gal+/GFP+ cells and the percentage of these cells in four separate livers is shown below (scale bar=50μm). B. Prom1+ cell generative capacity in adult mouse livers harbouring two different lineage tracing alleles and damaged by DDC treatment or partial hepatectomy (scale bars=50μm). C. Unsupervised hierarchical clustering of Prom1+ cell transcriptomes isolated normal newborn (NBNT) and adult (ADNT) livers as well as adult livers treated with DDC (ADDDC). D. AGDEX comparison of NBNT and ADDDC Prom1+ cell transcriptomes using the ADNT Prom1+ cell transcriptome as a common comparator. E. Left, survival curves of adult control and DDC treated Prom1C-L ; RosaZsG mice carrying the indicated alleles. P-value=difference in survival. Right, anatomical heatmaps of organ tumour incidence. Below, ratios of tumours in neonatal and adult liver. F=Fishers test of the difference; MHC=Mantel-Haenstzel-Cochran test of the difference. See also Figure S1, Table S2.
Figure 6
Figure 6. Cross-species comparison of gene mutation and expression in human cancers and tissue-matched Prom1+ stem cells predicts oncogene and TSG function
A. Overall approach taken to calculate the Log-Ratio Difference (LRD) of each gene (see Supplementary Methods). B. LRDs of known oncogenes and TSGs in liver, stomach, prostate and uterus. Dark grey zone, LRD −3 to +3. C. Predicted function of recurrently mutated genes in liver, stomach, prostate and uterine cancers based on LRD −3 to +3. Note preponderance of immune regulators in predicted oncogenes. See also Methods and Resources.
Figure 7
Figure 7. Proposed model for the role of cell intrinsic and extrinsic factors in determining organ cancer risk
We propose that extrinsic factors converge specifically on stem cells to induce mutations and/or tissue damage that provokes proliferative repair. Tissue-specific susceptibility of stem cells to induced mutations and their intrinsic, or damage-induced proliferative capacity, create a ‘perfect storm’ that ultimately determines organ cancer risk. The high expression of immune regulators by stem cells might enable early transforming cells to escape immunosurveillance. See also Methods and Resources.

Comment in

References

    1. Arndt K, Grinenko T, Mende N, Reichert D, Portz M, Ripich T, Carmeliet P, Corbeil D, Waskow C. CD133 is a modifier of hematopoietic progenitor frequencies but is dispensable for the maintenance of mouse hematopoietic stem cells. Proceedings of the National Academy of Sciences. 2013;110:5582–5587. - PMC - PubMed
    1. Ashford NA, Bauman P, Brown HS, Clapp RW, Finkel AM, Gee D, Hattis DB, Martuzzi M, Sasco AJ, Sass JB. Cancer risk: role of environment. Science. 2015;347:727. - PubMed
    1. Barker N, Huch M, Kujala P, van de Wetering M, Snippert HJ, van Es JH, Sato T, Stange DE, Begthel H, van den Born M, et al. Lgr5+ve Stem Cells Drive Self-Renewal in the Stomach and Build Long-Lived Gastric Units In Vitro. Cell Stem Cell. 2010;6:25–36. - PubMed
    1. Bennoun M, Rissel M, Engelhardt N, Guillouzo A, Briand P, Weber-Benarous A. Oval cell proliferation in early stages of hepatocarcinogenesis in simian virus 40 large T transgenic mice. The American journal of pathology. 1993;143:1326–1336. - PMC - PubMed
    1. Bienz M, Clevers H. Linking colorectal cancer to Wnt signaling. Cell. 2000;103:311–320. - PubMed

Publication types