. 2016 Aug 25;166(5):1147-1162.e15.
doi: 10.1016/j.cell.2016.07.025.

Cell-Type-Specific Alternative Splicing Governs Cell Fate in the Developing Cerebral Cortex

Affiliations

Cell-Type-Specific Alternative Splicing Governs Cell Fate in the Developing Cerebral Cortex

Xiaochang Zhang et al. Cell. .

Abstract

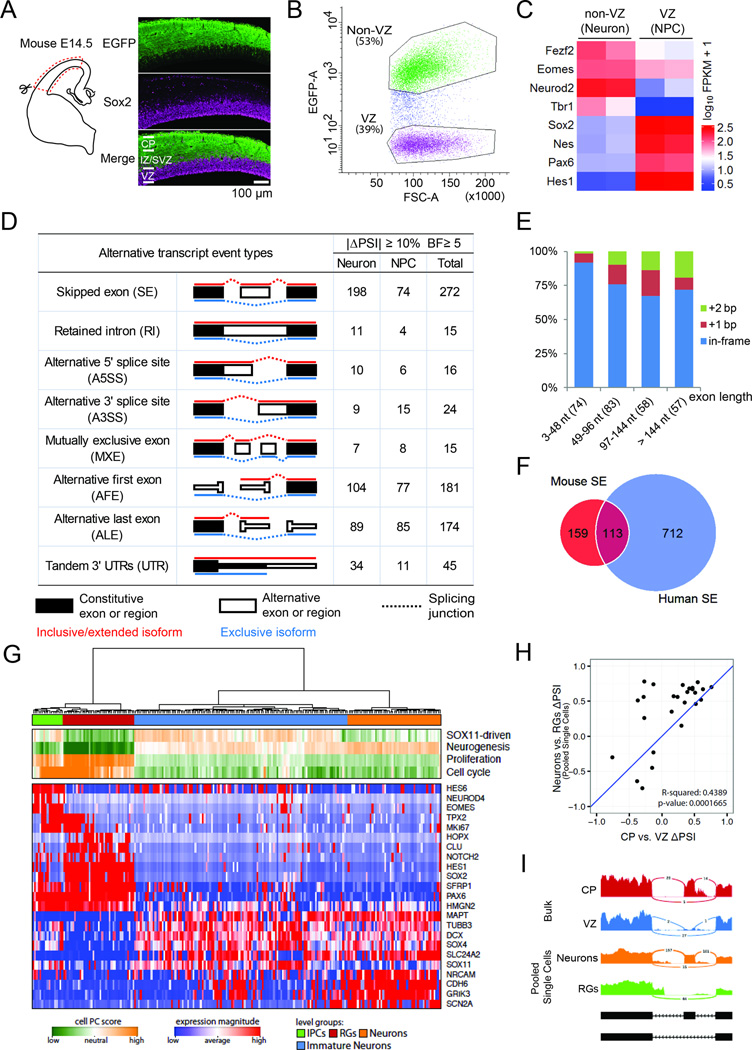
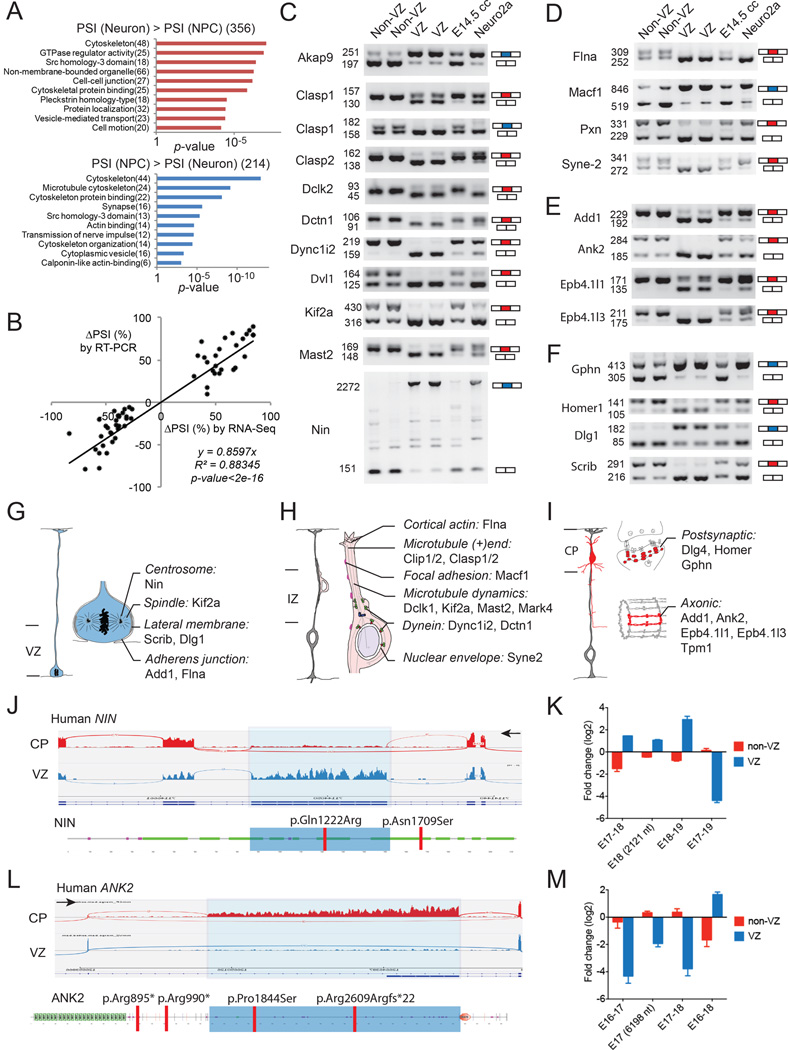
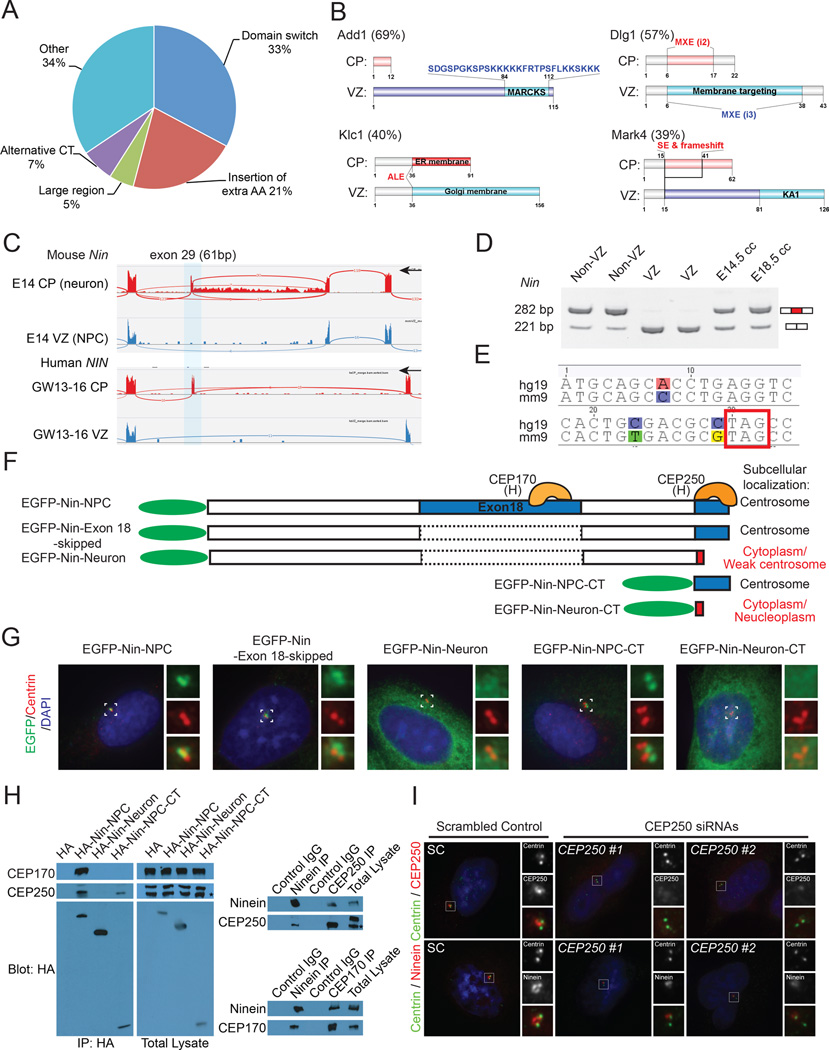
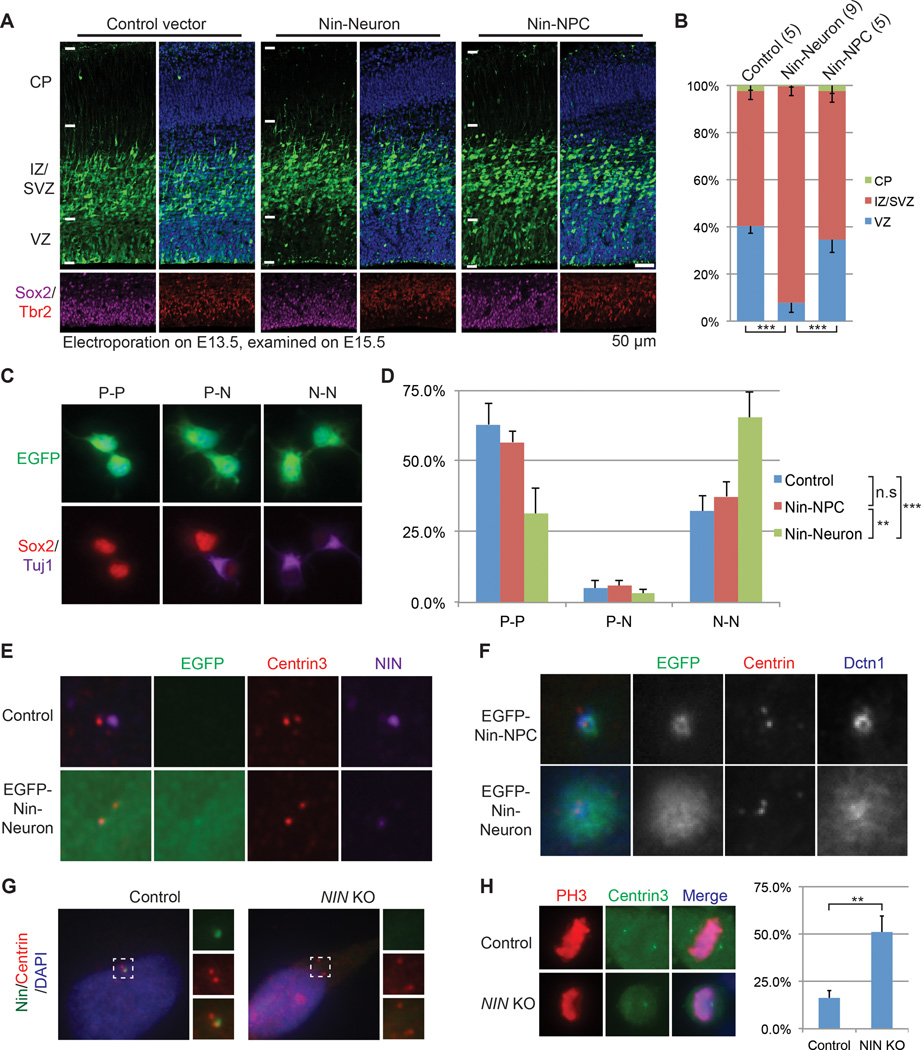
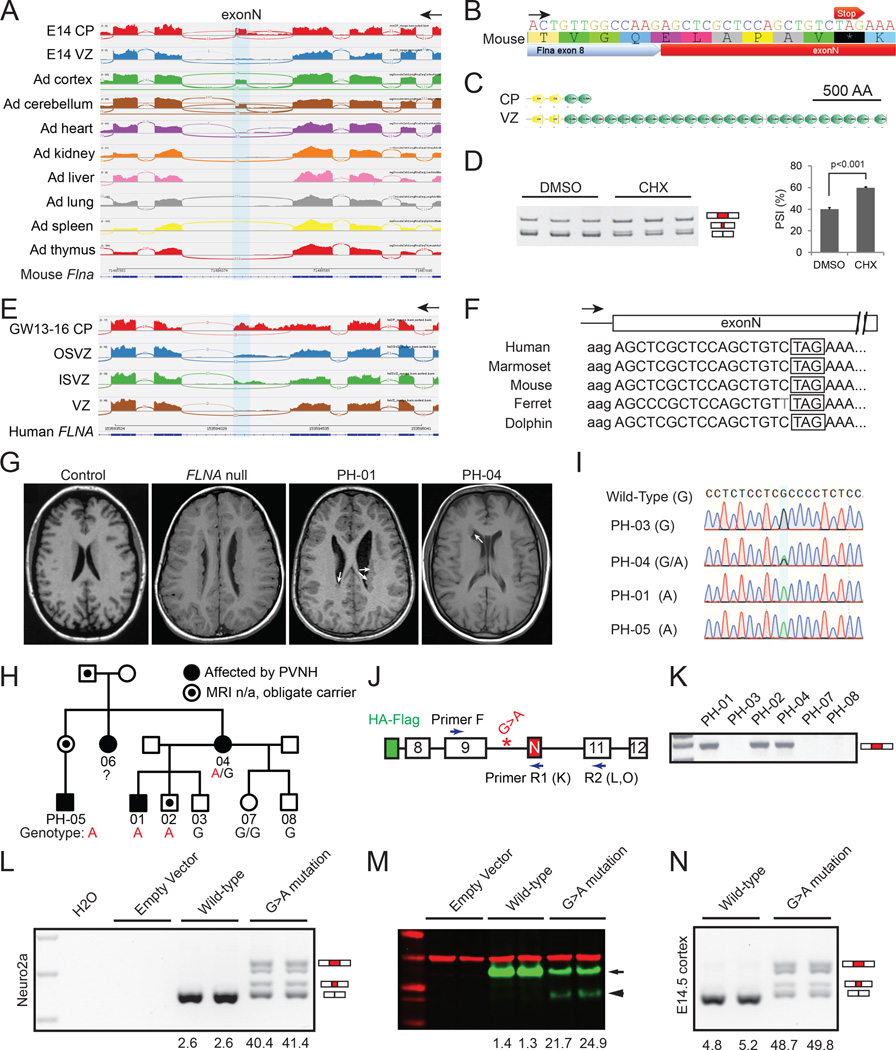
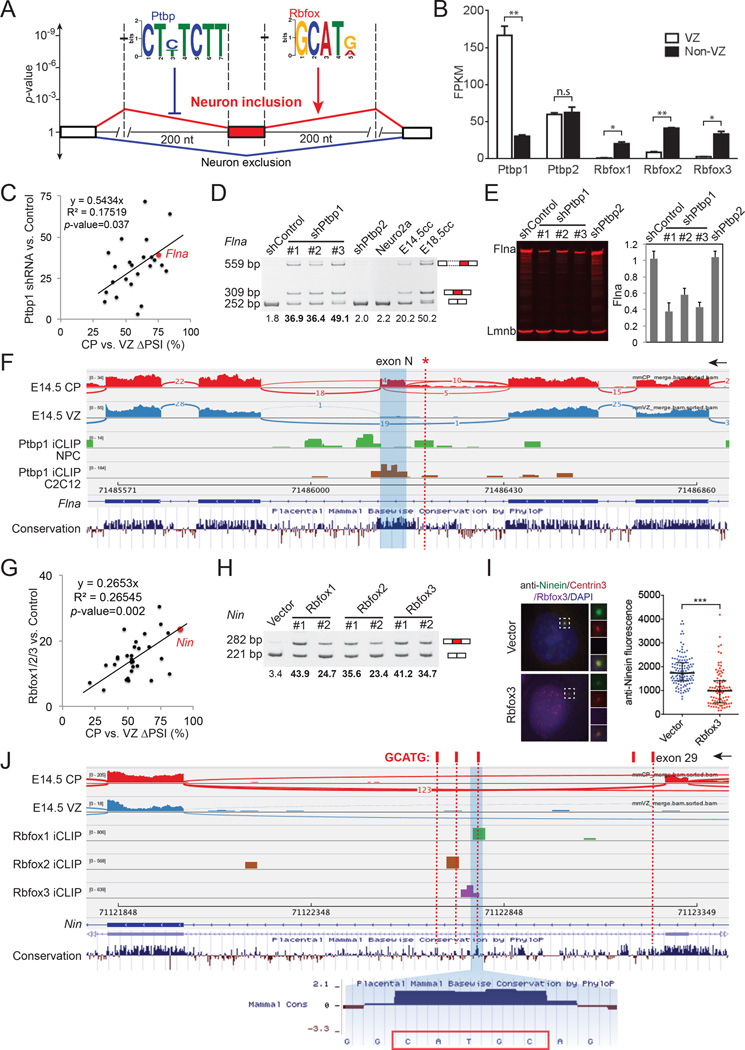
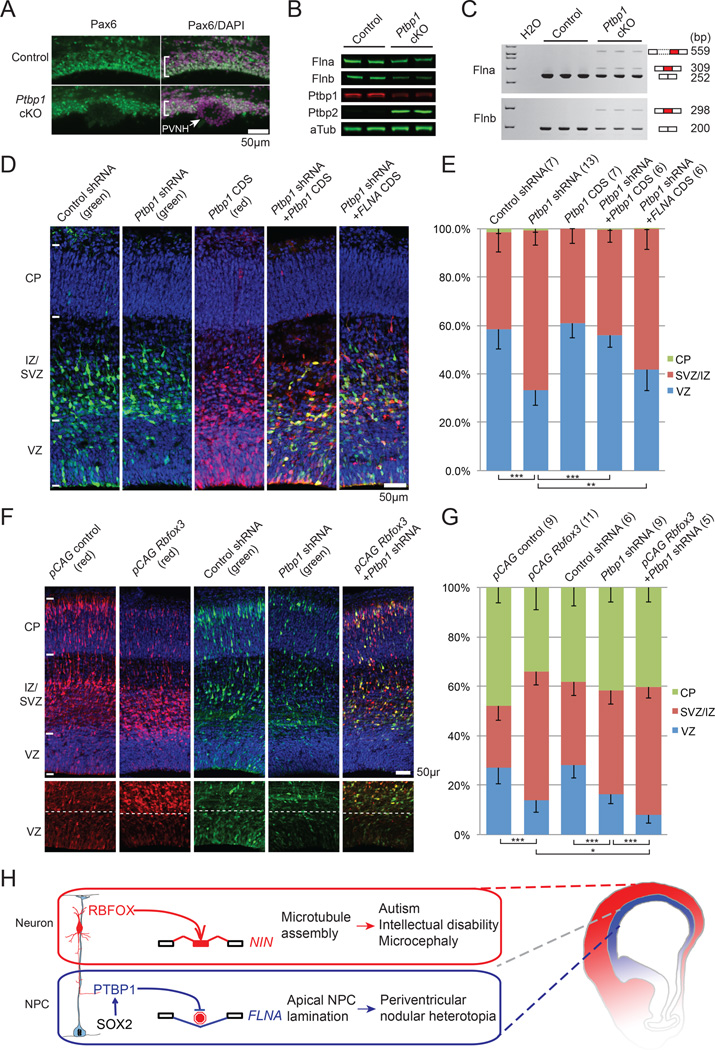
Alternative splicing is prevalent in the mammalian brain. To interrogate the functional role of alternative splicing in neural development, we analyzed purified neural progenitor cells (NPCs) and neurons from developing cerebral cortices, revealing hundreds of differentially spliced exons that preferentially alter key protein domains-especially in cytoskeletal proteins-and can harbor disease-causing mutations. We show that Ptbp1 and Rbfox proteins antagonistically govern the NPC-to-neuron transition by regulating neuron-specific exons. Whereas Ptbp1 maintains apical progenitors partly through suppressing a poison exon of Flna in NPCs, Rbfox proteins promote neuronal differentiation by switching Ninein from a centrosomal splice form in NPCs to a non-centrosomal isoform in neurons. We further uncover an intronic human mutation within a PTBP1-binding site that disrupts normal skipping of the FLNA poison exon in NPCs and causes a brain-specific malformation. Our study indicates that dynamic control of alternative splicing governs cell fate in cerebral cortical development.

Keywords: Ninein; Ptbp1; Rbfox; filamin A; microcephaly; mother centriole; periventricular nodular heterotopia.


Figures

Figure 1
Figure 1. Extensive and Conserved Alternative Exon Usages During Cerebral Cortical NPC Differentiation
A) Immunostaining of E14.5 Tbr2-EGFP mouse dorsal cerebral cortex with anti-EGFP (green) and anti-Sox2 (magenta). B) Fluorescence-activated cell sorting (FACS) of green and non-green cells from E14.5 Tbr2-EGFP mouse dorsal cerebral cortex. C) Heatmap of RNA-Seq results showing differential gene expression between sorted VZ and non-VZ cells. D) Number of alternative exons between neural progenitor cells (NPC) and differentiating neurons. E) Histogram showing the size of mouse SEs (x axis) and the percentages of SEs that cause an in-frame insertion or a frame shift (y axis). F) Conserved SEs in mouse and human cortical neurogenesis. G) PAGODA analysis distinguishes 224 single fetal cortical cells (Camp et al., 2015) into 4 clusters (green, blue, red, yellow). Shown at the bottom are gene expression patterns for selected marker genes. H) ΔPSI scores between pooled single cells and bulk samples show significant correlation. I) Sashimi plots from bulk and single cell analyses showing the last three exons of CERS5. See also Figure S1.
Figure 2
Figure 2. Alternative Splicing Preferentially Regulates Genes Encoding Cytoskeleton Proteins
A) Ontology analysis of genes that are alternatively spliced between E14.5 mouse NPCs and differentiating neurons, showing the top 10 ranked terms and count of genes (in parenthesis). B) RT-PCR analyses validate 57 AS events identified by MISO. ΔPSI = PSI (Neuron) – PSI (NPC). C) to F) RT-PCR validation of alternatively spliced SEs related to microtubule C), actin (D), Add1-Ank2-Epb4.1 complex (E) and synapse (F). “E14.5 cc” represents unsorted E14.5 mouse cerebral cortex. G) to I) Cartoon illustrations of alternatively spliced genes involved in NPC proliferation (G), radial neuronal migration (H) and neuronal differentiation (I). J) RNA-Seq reads of human NIN gene in GW13-16 VZ and CP (left), showing that the 2139 bp alternative exon is included in VZ (shaded in light blue). Red bars indicate mutations associated with microcephaly, one of which lies in the AS exon (Dauber et al., 2012). The black arrows here and in all following genome browser figures indicate the direction of gene transcription. K) qRT-PCR results show that the 2121 bp mouse homologous Nin exon is included in VZ but skipped in non-VZ cells. Data are represented as mean +/− SEM. L) RNA-Seq reads of human ANK2 gene showing the 6255bp alternative exon (shaded) is included in CP. Red bars indicate mutations associated with autism spectrum disorder, two of which lie in the AS exon (Iossifov et al., 2014). M) qRT-PCR analysis showing that the mouse homologous Ank2 exon of L) is included in non-VZ and skipped in VZ. Data are represented as mean +/− SEM. See also Figure S2 and Tables S1–S2.
Figure 3
Figure 3. Cell Type-specific Alternative Splicing Translocates Ninein from Centrosome in NPCs to Non-centrosomal Loci in Neurons
A) Impact of 61 cytoskeleton-related and conserved AS events on modular protein domains. AA, amino acids. CT, C-terminus. B) Alternative splicing alters protein domains that regulate subcellular localization. Gene names are followed by ΔPSI values. Differential protein domains are shaded red (neuron) or cyan (NPC). C) RNA-Seq reads in E14.5 mouse VZ and CP, and GW13-16 human VZ and CP showing that the alternative Nin (NIN) exon 29 is specifically included in neurons (CP). D) RT-PCR validates the specific inclusion of Nin exon 29 in differentiating neurons. E) Alignment of Nin exon 30, showing that insertion of exon 29 introduces a conserved premature stop codon. F) –G) Cartoon illustration of EGFP-Nin fusion constructs and their subcellular localization in transfected cells. H) Left: co-IP of transfected Ninein isoforms showing that Nin-NPC, but not the Nin-Neuron isoform, pulls down CEP170 and CEP250. Right: co-IP showing that endogenous Ninein interact with CEP170 and CEP250 in Hela cells. I) siRNA knockdown of CEP250 disrupts the centrosomal localization of Ninein. See also Figure S3 and Tables S3.
Figure 4
Figure 4. Ninein Neuronal Isoform Promotes NPC Differentiation
A–B) Expressing Nin-Neuron, but not the Nin-NPC isoform, in E13.5 mouse brains leads to fewer NPCs in the VZ at E15.5. Numbers in parentheses indicate the number of embryos (n) analyzed. Data are represented as mean +/− SD. C–D) Pair-cell analyses showing that expression of Nin-Neuron promotes neuron production. P, progenitor; N, neuron. Data are represented as mean +/− SD. E) Expression of Nin-Neuron isoform decreases the level of endogenous NIN at the centrosome. F) Expression of Nin-Neuron disperses Dctn1 away from centrosome. G) NIN signal is diminished in NIN knockout cells. H) NIN loss-of-function leads to defective mitotic spindles. Data are represented as mean +/− SD. See also Figure S4.
Figure 5
Figure 5. Cell Type-specific Alternative Splicing of Filamin A in Cerebral Cortical Development and Human PVNH
A) RNA-Seq reads around Flna exonN showing its higher inclusion in adult cerebral cortex, cerebellum and E14.5 CP, in comparison to E14.5 VZ and other non-neural adult tissues. B) Flna exonN has an in-frame stop codon. C) ExonN inclusion is predicted to truncate Flna protein. D) Blocking of NMD by cycloheximide (CHX) in primary hippocampal neurons cultured in vitro for 1 day increases inclusion of exonN. Data are represented as mean +/− SEM. E) RNA-Seq reads showing the inclusion of exonN and retention of its upstream intron in fetal human CP. F) Filamin A exonN is conserved across representative placental mammals. G) T1 brain MRI shows PVNH (white arrows) in affected individuals PH-01 (male) and PH-04 (female), compared to a healthy control and an unrelated individual with a FLNA null mutation. H) Pedigree showing inheritance of PVNH and the rare c.1429 +182 G>A mutation. I) Sanger sequencing traces showing the rare FLNA variant c.1429+182 G>A. J) A cartoon illustrating the FLNA mini-gene construct and primers used for RT-PCR. N-terminal HA and Flag tags were fused in-frame with exon 8. K) RT-PCR using primer F and R1 (inside exonN) detecting the abnormal exonN inclusion in blood samples of affected individuals. L) RT-PCR (primer pair F-R2) results on FLNA mini-genes expressed in Neuro2a cells, showing that the c.1429+182 G>A mutation caused > 40% of FLNA transcripts to include exonN. M) Western blot of transfected Neuro2a cells detecting the WT mini-FLNA (green, arrow) and the truncated form (arrow head). Red, anti-Gapdh. N) RT-PCR (primer pair F-R2) results of E14.5 mouse brains electroporated FLNA mini-genes on E13.5, showing that the G>A mutation caused abnormal inclusion of exonN. See also Figure S5.
Figure 6
Figure 6. Alternative Exons Showing Higher Inclusion in Neurons Are Antagonistically Regulated by Ptbp1 and Rbfox1/2/3 Proteins
A) Unbiased motif analysis of alternative exons with higher inclusion in differentiating neurons reveals the enrichment of CU(C/U)UCUU in the 200 nt 5’ upstream region and GCAU(G/A) in the 200 nt downtream intronic region. B) RNA-Seq results of sorted E14.5 mouse cortical cells showing that Ptbp1 is enriched in NPCs (VZ) and Rbfox1/2/3 transcripts are enriched in non-VZ cells. Data are represented as mean +/− SEM. C) A scatter plot showing that Ptbp1 knockdown in Neuro2a cells de-represses the inclusion of 24 neuronal exons predicted by motif search in A). D) RT-PCR analysis showing that Ptbp1 knockdown in Neuro2a cells by three different shRNAs promotes inclusion of Flna exonN. E) Western blot and quantified signals showing that Ptbp1 knockdown decreases Flna protein level. Data are represented as mean +/− SEM. F) iCLIP-Seq (re-analysis of (Linares et al., 2015; Masuda et al., 2012)) and RNA-Seq results showing that Ptbp1 binds directly to Flna exonN and its flanking introns in NPCs and C2C12 cells. Red asterisk and dotted line indicate chrX:71,486,253, the homologous nucleotide of human ChrX: 153,594,210 C>T mutation. The arrow indicates direction of transcription. G) Rbfox1/2/3 expression in Neuro2a cells promotes inclusion of 30 neuronal exons identified by motif analyses in A). H) RT-PCR results showing that ectopic expression of Rbfox1/2/3 promotes inclusion of Nin exon 29. I) Overexpression of Rbfox3 in U2OS cells decreases the protein level of centrosomal Nin (green). Data are represented as median +/− SD. J) Genome browser views of RNA-Seq and HITS-CLIP reads (re-analysis of (Weyn-Vanhentenryck et al., 2014)) showing that Rbfox1/2/3 proteins bind to conserved GCAUG motifs downstream of Nin exon 29 in mouse brains. Vertical red bars on top indicate GCATG sequences. See also Figure S6 and Table S4.
Figure 7
Figure 7. Ptbp1 and Rbfox Proteins Antagonistically Control Neural Progenitor Cell Differentiation
A) Immunostaining of E18.5 Ptbp1 conditional knockout (cKO, Nestin-Cre) cerebral cortex showing typical PVNH (white arrow) and thinner ventricular layer of Pax6+ cells (brackets). B) Western blot of Ptbp1 cKO and control MEF cells showing that proteins level of Ptbp1, Flna and Flnb are decreased in Ptbp1 cKO, while Ptbp2 level is increased. C) RT-PCR results showing that Ptbp1 cKO in MEF cells de-represses the inclusion of Flna exonN and a 98-nt Flnb exon. D) –E) Representative images and statistical analysis E) showing that Ptbp1 knockdown (green) at E13.5 results in reduced neural progenitors in the VZ at E15.5. The defect was partially rescued by co-expression of Ptbp1 coding sequence (CDS, red) or FLNA CDS. Numbers in parentheses indicate the number of embryos analyzed. Data are represented as mean +/− SD. F) –G) Representative images and statistical analysis G) showing that introducing Rbfox3 expression into E13.5 mouse brains resulted in reduced progenitor cells in the VZ and reduced neurons in the CP at E16.5. Ectopic expression of Rbfox3 on top of Ptbp1 knockdown causes a more severe depletion of NPCs in the VZ. Data are represented as mean +/− SD. H) A working model showing that Rbfox1/2/3 proteins are highly expressed in neurons and promote neuronal exon inclusion (red), while Ptbp1 is expressed in NPCs (blue, VZ) and represses neuronal exon inclusion. Sox2 binds to the promoter region of Ptbp1 (left). Dysregulation of Rbfox1/2/3 mediated AS may lead to brain disorders such as autism and intellectual disability. Mutations that de-represses neuronal exon inclusion in NPCs may result in PVNH (through FLNA). See also Figure S7.

Similar articles

Cited by

References

    1. Ayoub AE, Oh S, Xie Y, Leng J, Cotney J, Dominguez MH, Noonan JP, Rakic P. Transcriptional programs in transient embryonic zones of the cerebral cortex defined by high-resolution mRNA sequencing. Proceedings of the National Academy of Sciences of the United States of America. 2011;108:14950–14955. - PMC - PubMed
    1. Bailey TL. DREME: motif discovery in transcription factor ChIP-seq data. Bioinformatics. 2011;27:1653–1659. - PMC - PubMed
    1. Baird DH, Myers KA, Mogensen M, Moss D, Baas PW. Distribution of the microtubule-related protein ninein in developing neurons. Neuropharmacology. 2004;47:677–683. - PubMed
    1. Barbosa-Morais NL, Irimia M, Pan Q, Xiong HY, Gueroussov S, Lee LJ, Slobodeniuc V, Kutter C, Watt S, Colak R, et al. The evolutionary landscape of alternative splicing in vertebrate species. Science. 2012;338:1587–1593. - PubMed
    1. Belgard TG, Marques AC, Oliver PL, Abaan HO, Sirey TM, Hoerder-Suabedissen A, Garcia-Moreno F, Molnar Z, Margulies EH, Ponting CP. A transcriptomic atlas of mouse neocortical layers. Neuron. 2011;71:605–616. - PMC - PubMed

Publication types

MeSH terms