. 2016 Aug 25;166(5):1163-1175.e12.
doi: 10.1016/j.cell.2016.07.008.

Phase Transition in Postsynaptic Densities Underlies Formation of Synaptic Complexes and Synaptic Plasticity

Affiliations

Phase Transition in Postsynaptic Densities Underlies Formation of Synaptic Complexes and Synaptic Plasticity

Menglong Zeng et al. Cell. .

Abstract

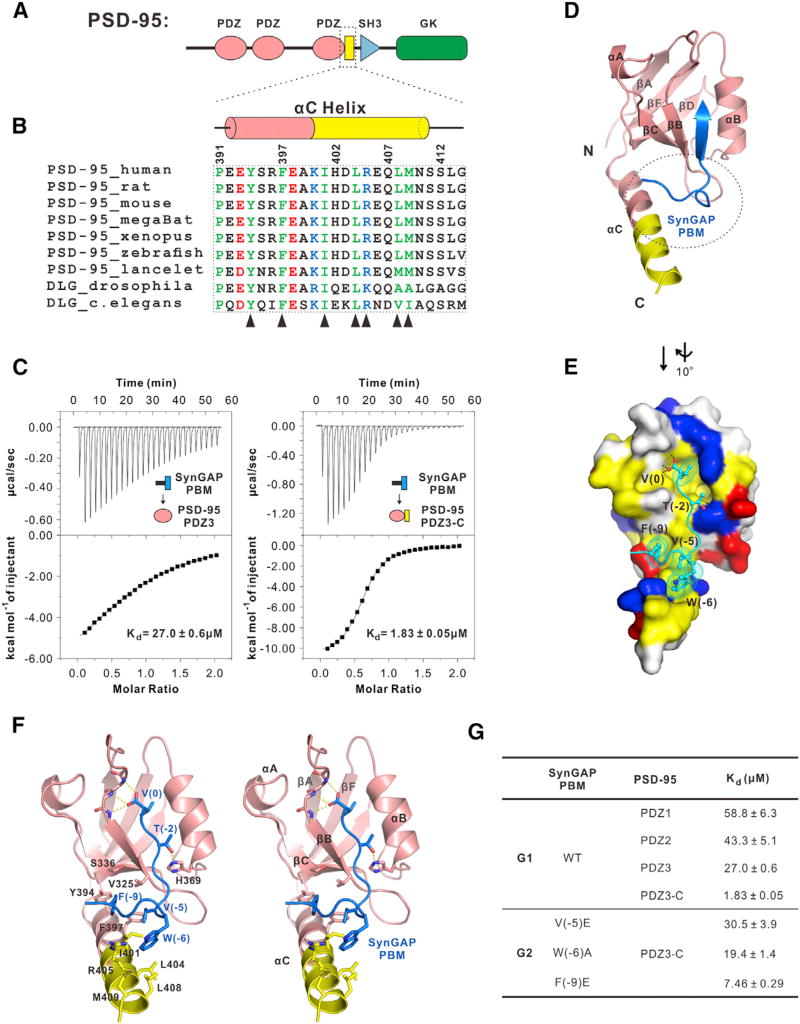
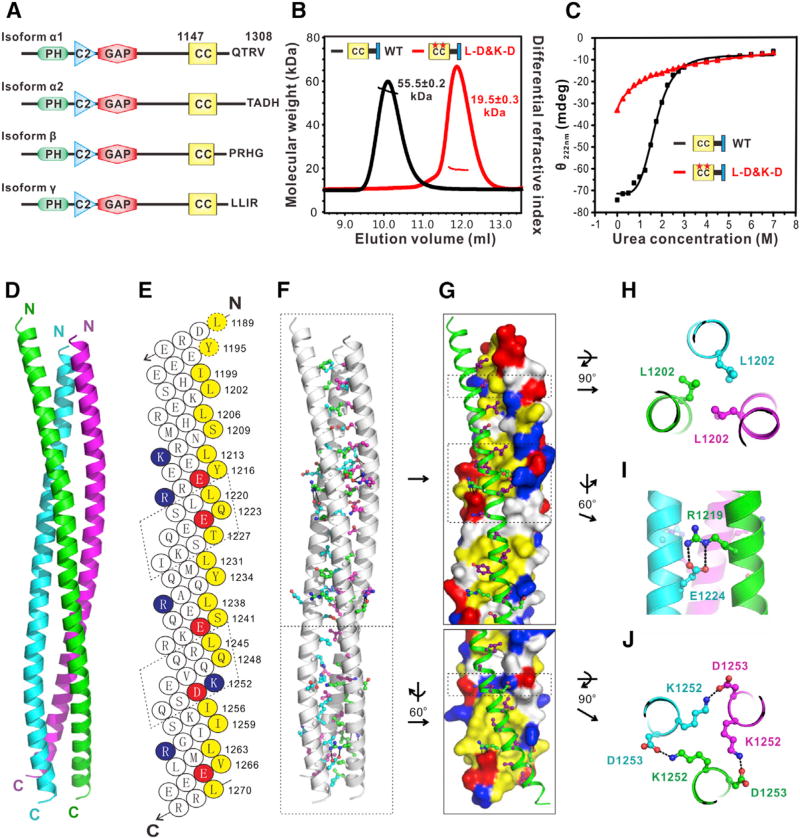
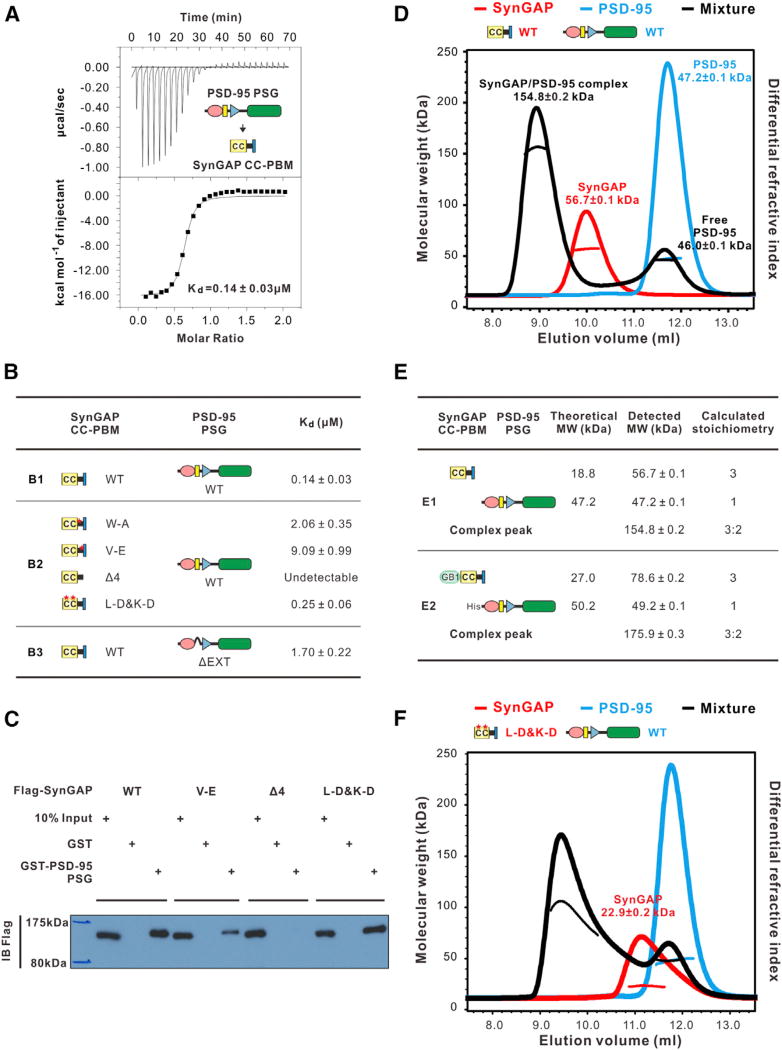
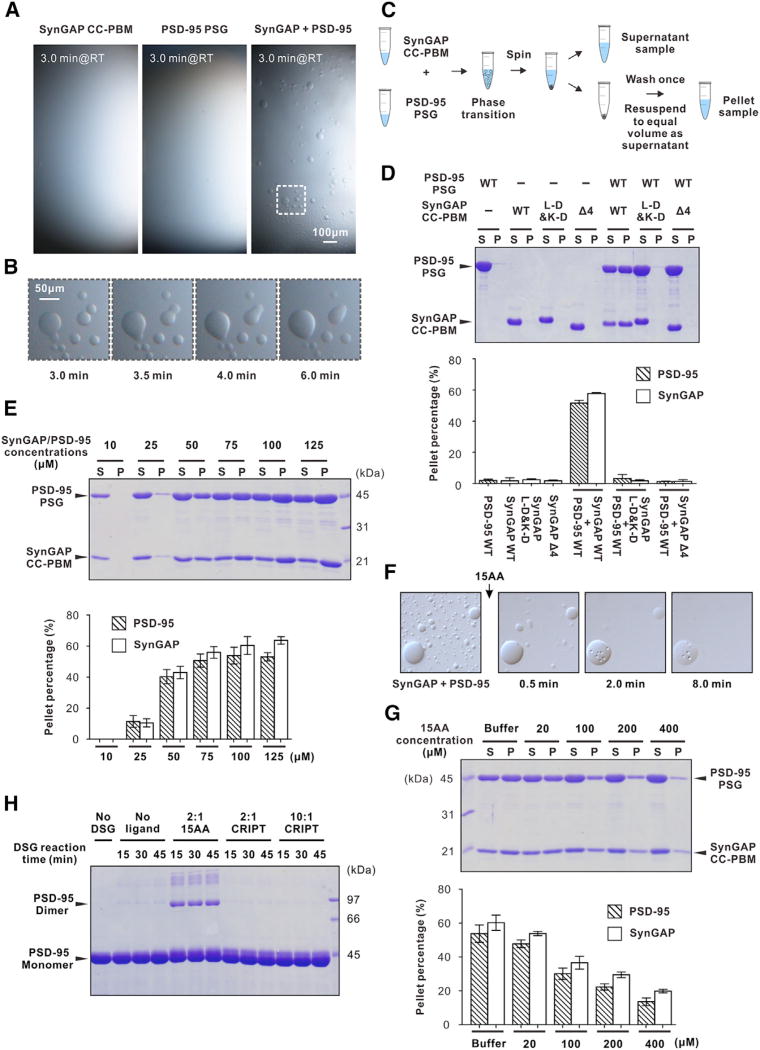
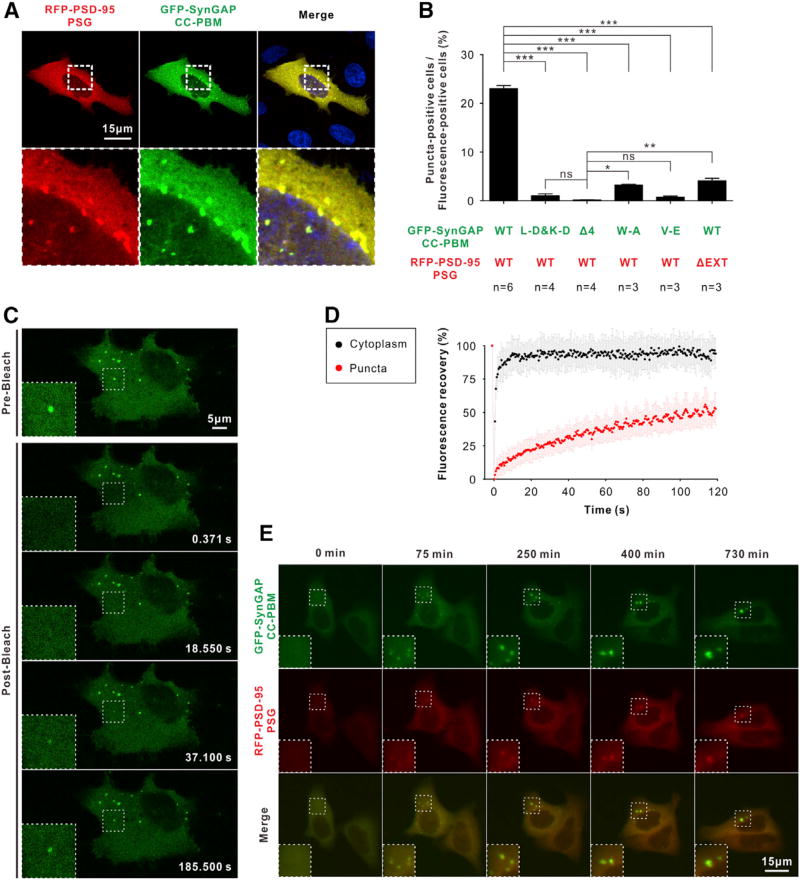
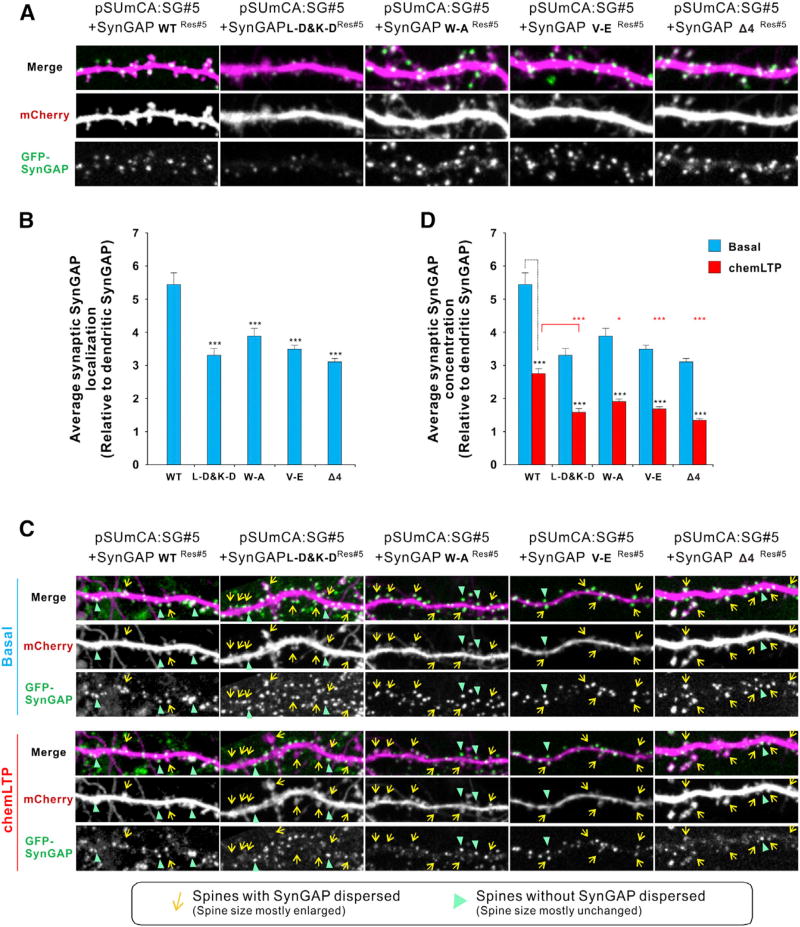
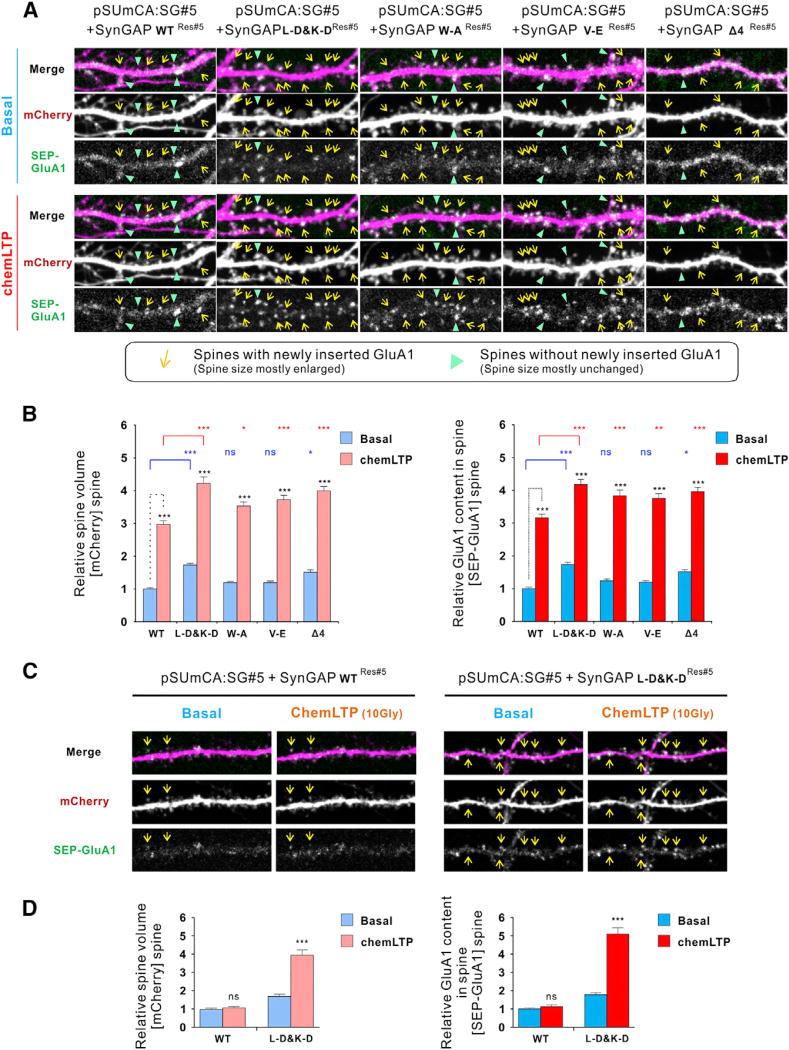
Postsynaptic densities (PSDs) are membrane semi-enclosed, submicron protein-enriched cellular compartments beneath postsynaptic membranes, which constantly exchange their components with bulk aqueous cytoplasm in synaptic spines. Formation and activity-dependent modulation of PSDs is considered as one of the most basic molecular events governing synaptic plasticity in the nervous system. In this study, we discover that SynGAP, one of the most abundant PSD proteins and a Ras/Rap GTPase activator, forms a homo-trimer and binds to multiple copies of PSD-95. Binding of SynGAP to PSD-95 induces phase separation of the complex, forming highly concentrated liquid-like droplets reminiscent of the PSD. The multivalent nature of the SynGAP/PSD-95 complex is critical for the phase separation to occur and for proper activity-dependent SynGAP dispersions from the PSD. In addition to revealing a dynamic anchoring mechanism of SynGAP at the PSD, our results also suggest a model for phase-transition-mediated formation of PSD.


Figures

Figure 1
Figure 1. Structural Basis Governing the Specific Interaction between PSD-95 and SynGAP
(A) Schematic diagram showing the domain organization of PSD-95. (B) PSD-95 PDZ3 contains a conserved and elongated C-terminal α-helix extension (αC helix). Part of this αC helix (marked in pink) has been previously identified. In the sequence alignment, conserved residues are colored. The residues directly involved in binding to SynGAP PBM are indicated by triangles. (C) ITC-based measurements comparing SynGAP PBM’s binding to PSD-95 PDZ3 and PDZ3-C. (D) Ribbon diagram representation of the PSD-95 PDZ3-C/SynGAP PBM complex structure. The segment upstream of the canonical SynGAP PBM is highlighted with a dashed oval (also see Figure S1). (E) Combined surface diagram (PSD-95 PDZ3-C) and stick-ball model (SynGAP PBM) showing the inter-molecular interaction between PSD-95 PDZ3-C and SynGAP PBM. In the surface map, hydrophobic residues are drawn in yellow; positively charged residues are in blue; and negatively charged residues are in red. (F) Stereo view showing the detailed interactions between PSD-95 PDZ3-C and SynGAP PBM. (G) ITC-based measurements summarizing the binding affinities between SynGAP PBM and three individual PDZ domains from PSD-95 (G1) and between various SynGAP PBM mutants and PSD- 95 PDZ3-C (G2).
Figure 2
Figure 2. SynGAP Forms a Parallel Coiled-Coil Trimer
(A) Schematic diagram showing the domain organization of SynGAP. (B) FPLC-coupled static light-scattering analysis showing that WT SynGAP CC-PBM forms a stable trimer in solution, while the “L-D&K-D” mutant is a monomer. (C) CD spectra-based urea-induced denaturation curves comparing denaturation profiles of Syn- GAP WT CC-PBM and “L-D&K-D” mutant. (D) Ribbon diagram representation of the SynGAP coiled-coil trimer. The SynGAP coiled-coil forms a parallel, asymmetric coiled-coil trimer (see also Figure S3). (E) Helical net diagram of one helical strand of the SynGAP coiled-coil trimer. The two hendecad repeats are shown in the dashed boxes. The residues in the a/d positions of the heptad repeats and those in the a/d/x positions of the hendecad repeats are highlighted in yellow. The residues that contribute to charge-charge interactions are colored in blue (Lys and Arg) and red (Asp and Glu), respectively. (F) Combined ribbon and stick-ball models showing the trimer interfaces of the SynGAP coiled-coil. (G) Combined surface and ribbon models showing the interactions of the coiled-coil trimer. The side chains of hydrophobic and charged residues in the ribbon scheme are colored in magenta and green, respectively. The coloring code of the surface diagram is identical to that in Figure 1E. (H) Close-up view of L1202 in the trimer interfaces. (I and J) Close-up view of the interactions between R1219 and E1224 and between K1252 and D1253, respectively.
Figure 3
Figure 3. SynGAP CC-PBM Binds to PSD-95 PSG in a 3:2 Stoichiometry
(A) ITC measurement of the interaction between SynGAP CC-PBM and PSD-95 PSG. (B) Summary of ITC-derived binding affinities between various SynGAP CC-PBM and PSD- 95 PSG. (C) Pull-down assay comparing PSD-95 PSG binding to various forms of the full-length SynGAP. (D) FPLC-coupled static light-scattering analysis showing that mixing equal molar of SynGAP CC- PBM and PSD-95 PSG leads to a formation of a3:2 CC-PBM/PSG complex (black curve). The elution profiles of isolated SynGAP CC-PBM (red curve) and PSD-95 PSG (cyan curve) are also included. The calculated molecular mass and fitting error of each peak is indicated above the peak. The experiments were repeated three times using different batches of proteins. (E) Summary of the theoretical and measured molecular weights of the SynGAP CC-PBM/PSD- 95 PSG complex using recombinant proteins without (E1) or with (E2) tags (see also Figure S5). (F) Static light-scattering assay showing that the monomeric L-D&K-D mutant of SynGAP CC-PBM can still form complex with PSD-95 PSG, albeit that the formed complex is not homogenous.
Figure 4
Figure 4. Phase Transition of the SynGAP CC-PBM/PSD-95 PSG Complex
(A) Isolated SynGAP CC-PBM and PSD-95 PSG solutions are stable and homogeneous at 100 µM concentration under light microscope at room temperature (RT). Mixing the two proteins, each at a concentration of 100 µM, resulted in formation of numerous droplets. The images shown in the figure were acquired 3 min and onward after mixing. The dashed box is the region of zoomed-in analysis in (B). (B) The small droplets underwent time-dependent coalescence into larger ones. (C) Schematic diagram illustrating the sedimentation assay to separate the condensed liquid phase and the aqueous phase of the SynGAP CC-PBM/PSD-95 PSG mixtures in the rest of the study. (D) Representative SDS-PAGE analysis and quantification data showing the distribution of proteins between aqueous-solution/supernatant (S) and condensed liquid phase/pellet (P) fractions for various SynGAP CC-PBM/PSD-95 PSG mixtures. The concentration of each protein in all of the experiments is at 100 µM, calculated as their monomer units. (E) Sedimentation assay showing that the phase transition of the SynGAP/PSD-95 complex is concentration dependent. SynGAP and PSD-95 were mixed at a 1:1 ratio at various concentrations, and the proteins were quantified by their band intensities. (F) Time-lapse DIC images of SynGAP CC-PBM/ PSD-95 PSG mixture (1:1 at 100 µM) showing numerous droplets at RT in a coverslip chamber. Droplets are rapidly dispersed after adding the 15AA peptide (see also Movie S1). The arrow refers to the time point of adding the 15AA peptide to the mixture. (G) SDS-PAGE analysis and quantification results showing pre-formed SynGAP/PSD-95 droplets can be reversed to aqueous phase by the competing 15AA peptide. The indicated concentrations of the peptide or a peptide-free buffer was added to a 1:1 SynGAP/PSD-95 mixture at 100 µM. (H) DSG-mediated cross-linking reveals PSD-95 PSG undergoes a SynGAP peptide binding-induced dimerization. The CRIPT peptide does not induce dimer formation of PSD-95 PSG. The peptide to PSD-95 molar ratio and reaction time are indicated in the figure. All statistic data in this figure represent the results from three independent batches of experiments and are expressed as mean ± SD.
Figure 5
Figure 5. The SynGAP/PSD-95 Complex Forms Condensed Liquid Phase in Living Cells
(A) Representative images showing co-expression of GFP-SynGAP CC-PBM and RFP-PSD-95 PSG in HeLa cells produce multiple bright puncta containing both fluorophores. Dashed boxes show the zoomed-in regions. (B) Trimer-disruption mutant (“L-D&K-D”) or PSD- 95 PDZ binding mutants (“Δ4,” “W-A” and “V-E” on SynGAP or “ΔEXT” on PSD-95) showing significantly decreased puncta formation when compared to the WT proteins (n = number of batch of cultures with >600 cells counted for each batch). Data are presented as mean ± SEM; ns, not significant, *p < 0.05, **p < 0.01, and ***p < 0.001 using one-way ANOVA with Tukey’s multiple comparison test. (C) Representative time-lapse FRAP images showing that GFP-SynGAP signal within the puncta recovered within a few minutes (see also Movie S2). (D) Quantitative results for FRAP analysis of GFP-SynGAP CC-PBM in puncta and cytoplasm of HeLa cells. The red curve represents the averaged FRAP data of 24 puncta from 13 cells, and the black curve is the averaged FRAP data of 12 cytoplasmic regions from six cells. Time 0 refers to thetime point of the photobleaching pulse. All data are represented as mean ± SD. (E) Representative time-lapse images showing that the GFP-SynGAP CC-PBM and RFP-PSD-95 PSG-positive puncta undergo time-dependent fusion (see also Movie S3).
Figure 6
Figure 6. The Multivalent SynGAP/PSD-95 Interaction Is Critical for Synaptic Localization and Proper Activity-Induced Dispersion of SynGAP from Synapses
(A and B) Endogenous SynGAP was replaced with GFP-SynGAP WT or its mutants using an shRNA molecular replacement strategy. mCherry was cotransfected as cell morphology marker. Average synaptic enrichment levels of SynGAP were quantified (n = 31 pairs of spines and dendrites from 6 independent experiments/neurons for each group were analyzed). (C and D) Activity-dependent synaptic dispersion of replaced SynGAP WT and its mutants during chemLTP (n = 31 pairs of spines and dendrites from six independent experiments/neurons for each group were analyzed). Spines were analyzed before and after chemLTP using live-imaging techniques. Data are presented as mean ± SEM; *p < 0.05 and ***p < 0.001 using one-way ANOVA with Tukey’s multiple comparison test.
Figure 7
Figure 7. The Role of Trimer Formation and PSD-95 Binding on SynGAP-Regulated Synaptic Plasticity
(A and B) Endogenous SynGAP was replaced by SynGAP WT or its various mutants. SEP-GluA1 and mCherry were transfected for monitoring AMPA receptor trafficking and synaptic spine morphology during chemLTP, respectively (n = 86 spines from 16 independent experiments/ neurons for each group were analyzed). Spines were analyzed before and after chemLTP using live imaging. (C and D) In threshold LTP experiments, weak LTP stimulus (10 µM glycine/0 Mg2+) was given to neurons with WT or L-D&K-D SynGAP replacement (n = 16 spines from three independent experiments/ neurons for each group were analyzed). Spines were analyzed before and after chemLTP using live imaging. Data are presented as mean ± SEM; ns, not significant, *p < 0.05, **p < 0.01 and ***p < 0.001 using one-way ANOVA with Tukey’s multiple comparison test.

Comment in

Similar articles

Cited by

References

    1. Adams PD, Afonine PV, Bunkoczi G, Chen VB, Davis IW, Echols N, Headd JJ, Hung LW, Kapral GJ, Grosse-Kunstleve RW, et al. PHENIX: a comprehensive Python-based system for macromolecular structure solution. Acta Crystallogr D Biol Crystallogr. 2010;66:213–221. - PMC - PubMed
    1. Araki Y, Zeng M, Zhang M, Huganir RL. Rapid dispersion of SynGAP from synaptic spines triggers AMPA receptor insertion and spine enlargement during LTP. Neuron. 2015;85:173–189. - PMC - PubMed
    1. Banjade S, Rosen MK. Phase transitions of multivalent proteins can promote clustering of membrane receptors. eLife. 2014;3:e04123. - PMC - PubMed
    1. Baron MK, Boeckers TM, Vaida B, Faham S, Gingery M, Sawaya MR, Salyer D, Gundelfinger ED, Bowie JU. An architectural framework that may lie at the core of the postsynaptic density. Science. 2006;311:531–535. - PubMed
    1. Berryer MH, Hamdan FF, Klitten LL, Møller RS, Carmant L, Schwart-zentruber J, Patry L, Dobrzeniecka S, Rochefort D, Neugnot-Cerioli M, et al. Mutations in SYNGAP1 cause intellectual disability, autism, and a specific form of epilepsy by inducing haploinsufficiency. Hum. Mutat. 2013;34:385–394. - PubMed

Publication types

MeSH terms

Substances