. 2016 Aug 25;166(5):1295-1307.e21.
doi: 10.1016/j.cell.2016.07.041.

Proteomic Analysis of Unbounded Cellular Compartments: Synaptic Clefts

Affiliations

Proteomic Analysis of Unbounded Cellular Compartments: Synaptic Clefts

Ken H Loh et al. Cell. .

Abstract

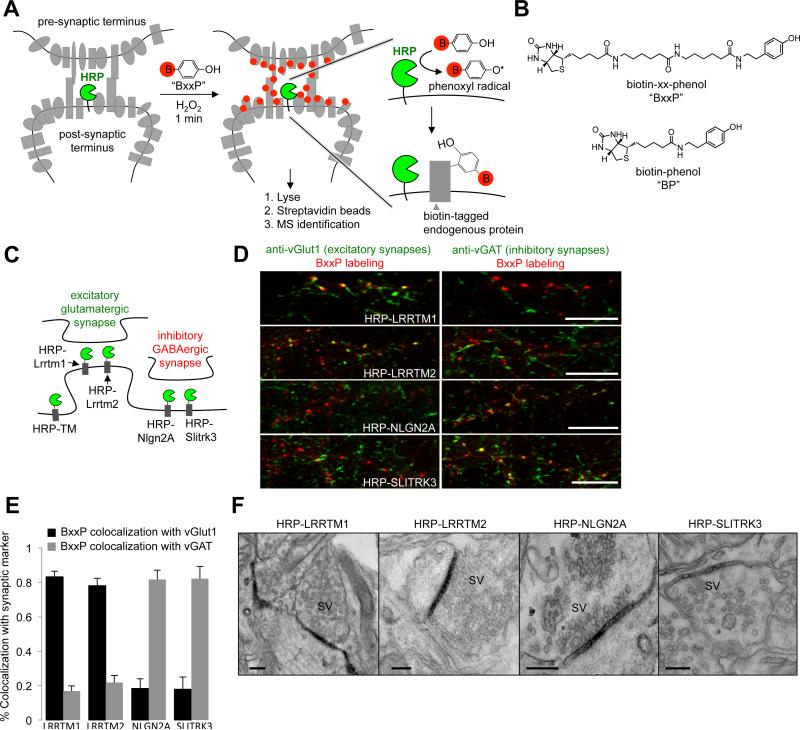
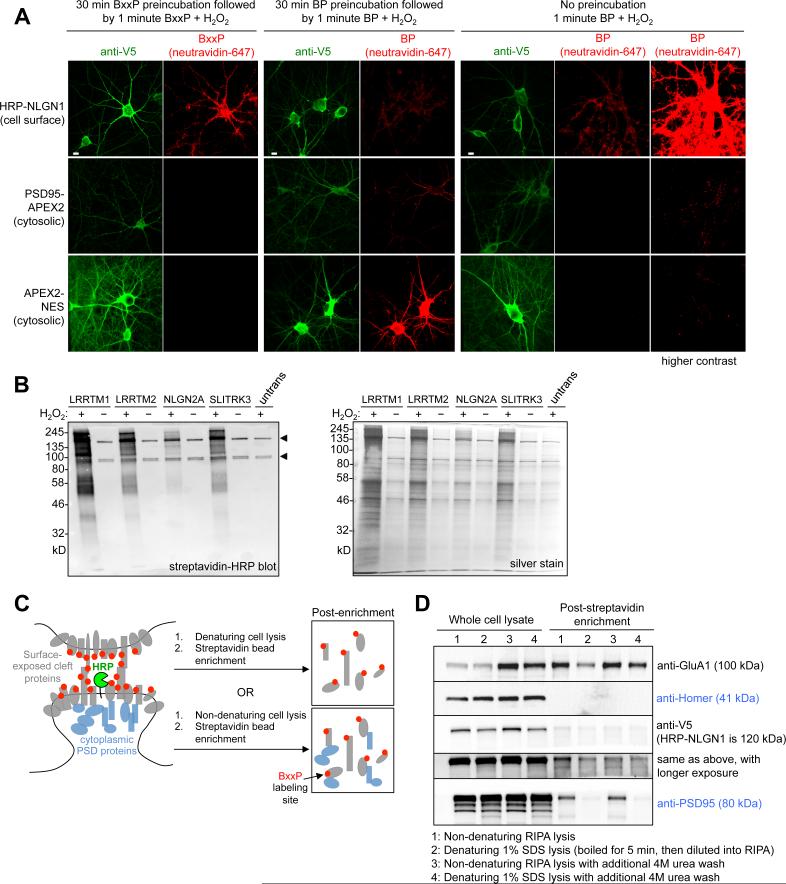
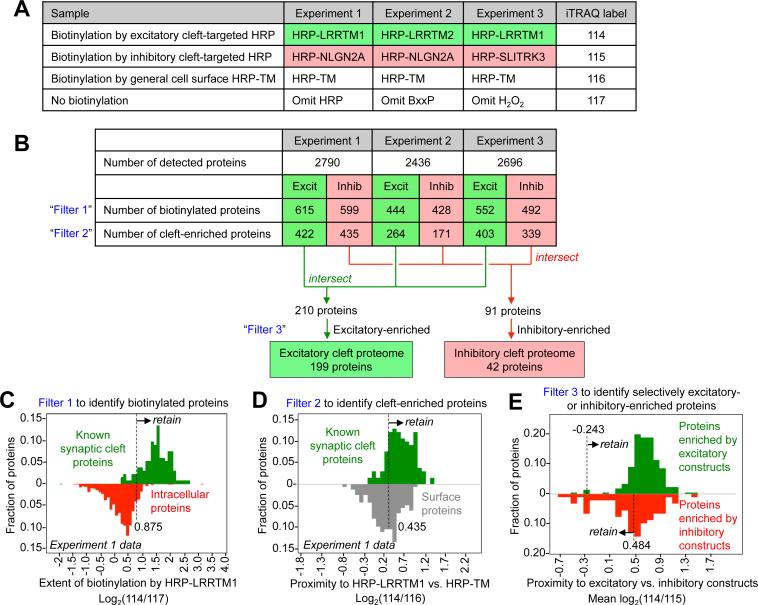
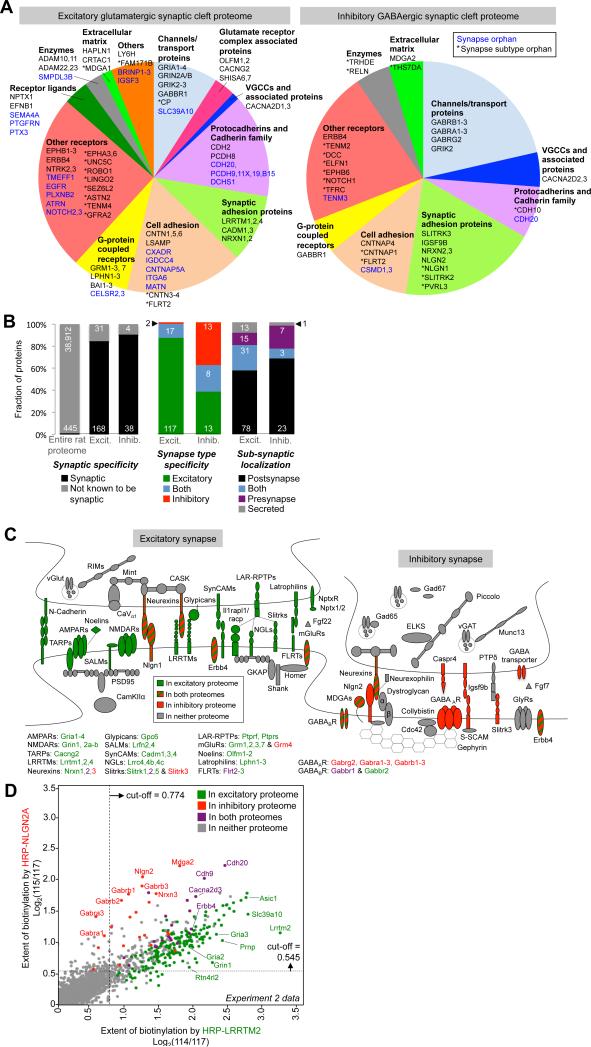
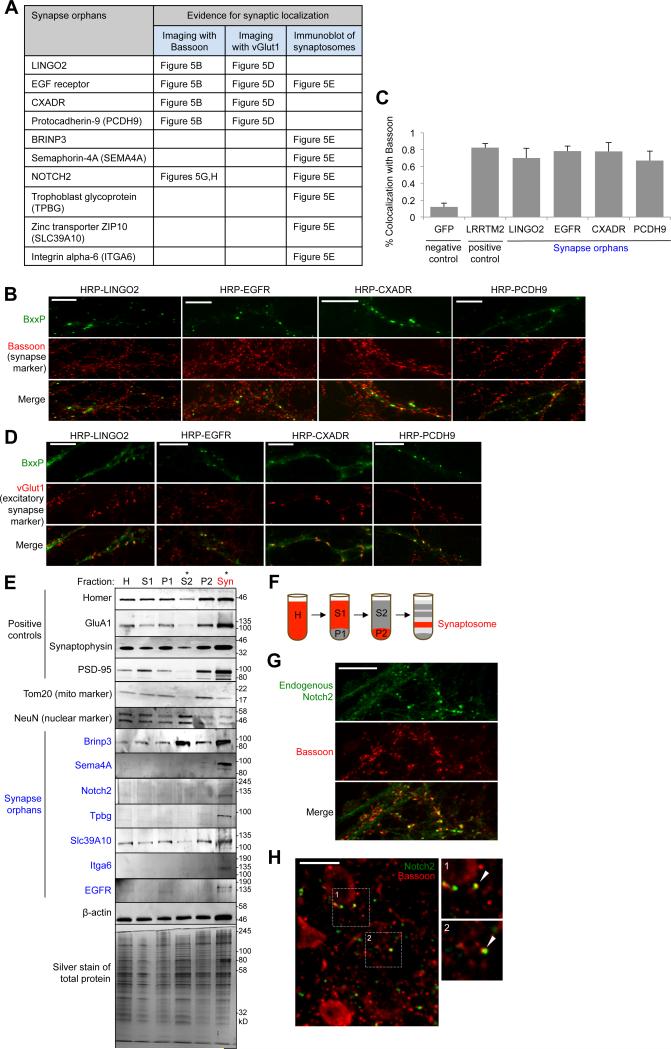
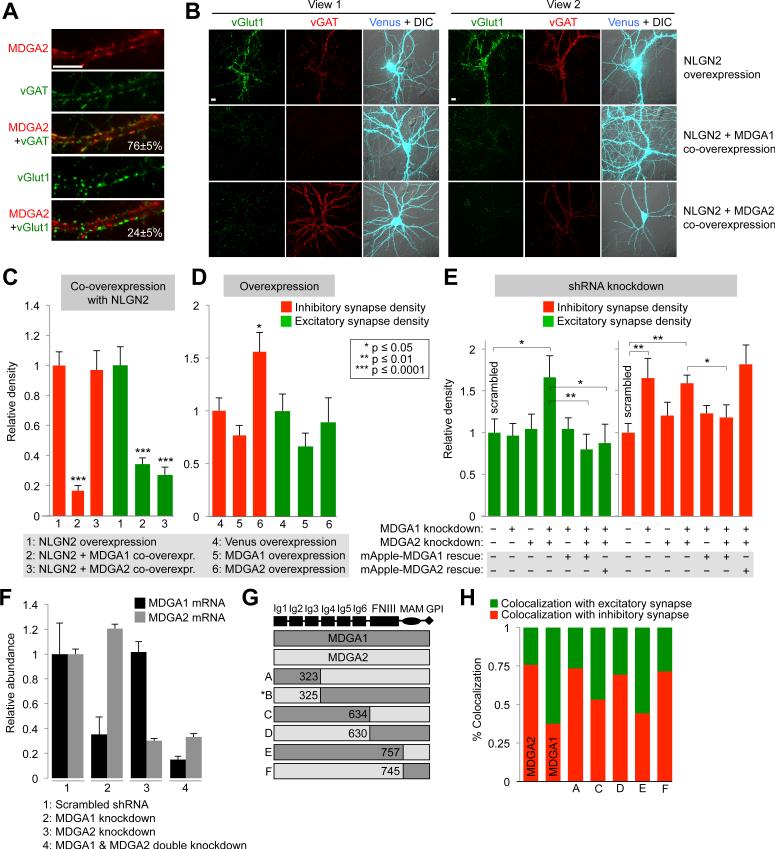
Cellular compartments that cannot be biochemically isolated are challenging to characterize. Here we demonstrate the proteomic characterization of the synaptic clefts that exist at both excitatory and inhibitory synapses. Normal brain function relies on the careful balance of these opposing neural connections, and understanding how this balance is achieved relies on knowledge of their protein compositions. Using a spatially restricted enzymatic tagging strategy, we mapped the proteomes of two of the most common excitatory and inhibitory synaptic clefts in living neurons. These proteomes reveal dozens of synaptic candidates and assign numerous known synaptic proteins to a specific cleft type. The molecular differentiation of each cleft allowed us to identify Mdga2 as a potential specificity factor influencing Neuroligin-2's recruitment of presynaptic neurotransmitters at inhibitory synapses.


Figures

Figure 1
Figure 1. Design and characterization of peroxidase fusion constructs for proximity biotinylation
(A) Scheme of peroxidase-mediated proteomic tagging in the synaptic cleft. Horseradish peroxidase (HRP) is genetically targeted to the cleft via fusion to a known cleft protein. The grey shapes are endogenous proteins residing inside and outside the synapse. To initiate labeling, the membrane impermeant biotin-phenol conjugate BxxP (red B = biotin; chemical structure in (B)) is added to the live neurons for 1 minute together with the oxidant H2O2. HRP converts BxxP into a phenoxyl radical, which covalently tags proximal endogenous proteins at electron rich side-chains such as Tyr (Rhee et al., 2013). Subsequently, neurons are lysed and biotinylated proteins are isolated using streptavidin beads for identification by mass spectrometry (MS). (B) Structure of BxxP and BP probes. (C) HRP fusion constructs employed in this study. HRP-TM is a general cell surface construct. (D) Fluorescence imaging of synaptic HRP fusion constructs with respect to excitatory and inhibitory synapse markers, vGlut1 and vGAT. For maximum detection sensitivity, the HRP constructs were visualized via BxxP labeling followed by neutravidin-AlexaFluor647 staining (red). Scale bars, 10 m. See also Figures S1-S4 for additional characterization of constructs and their expression levels. (E) Quantitation of colocalization extent for images in (D) plus 7 other fields of view containing >900 puncta per construct. Errors, ±1 s.d. (F) Electron microscopy (EM) of HRP fusion constructs. HRP catalyzes the polymerization and local deposition of diaminobenzidine, which recruits electron-dense osmium (Martell et al., 2012). SV, synaptic vesicles. Scale bars, 200 nm. See also Figure S2C for additional EM.
Figure 2
Figure 2. Development of BxxP probe for cell surface labeling and alternative streptavidin enrichment protocol
(A) Characterization of BxxP membrane impermeability. Neurons expressing the indicated peroxidase fusion construct (left) were labeled live with BxxP or BP, then fixed and stained. HRP at the cell surface gives biotinylation with both BxxP and BP, whereas intracellular peroxidase fusion constructs show biotinylation with BP only. (B) Gel analysis of streptavidin-enriched lysates after live-neuron biotinylation with HRP fusion constructs. Untrans, untransfected neurons. Arrowheads point to endogenously biotinylated proteins (Chapman-Smith and Cronan, 1999). (C) Development of lysis conditions to separate biotinylated cleft proteins from cytosolic post-synaptic density (PSD) proteins. Our standard RIPA lysis (bottom) retrieved many intracellular PSD proteins (blue) along with biotinylated (red) cleft-exposed proteins (grey). (D) Four different lysis/wash conditions were tested to solubilize the PSD and retrieve proteins biotinylated by HRP-NLGN1 and BxxP. Blotting of streptavidin-enriched lysates for a cleft marker (GluA1) and intracellular markers (Homer and PSD95) showed that conditions 2 and 4 removed the latter while retaining the former. Condition 2 was used for large-scale proteomics. Condition 1 was used in previous studies (Hung et al., 2014; Rhee et al., 2013). The anti-V5 blot detects HRP-NLGN1. See also Figure S4.
Figure 3
Figure 3. Design of proteomic study and cut-off analysis
A) Design of three independent proteomic experiments. Each experiment consisted of four samples, which were separately enriched and tagged with unique iTRAQ labels (right). Mass spectrometry (MS) was performed on the mixture of four samples, resulting in four mass-shifted peaks of varying intensity per detected peptide. (B) Filtering of MS data to produce excitatory and inhibitory proteomic lists. The table shows the number of proteins remaining after each filtering step. In the first row, a protein was considered detected if two or more unique peptides were sequenced by MS. Filter 1 retains HRP-biotinylated proteins and removes non-specific bead binders, on the basis of 114/117 or 115/117 iTRAQ ratio. Filter 2 retains cleft-enriched proteins over general cell surface proteins, on the basis of 114/116 or 115/116 iTRAQ ratio. Filter 3 removes strongly inhibitory-enriched proteins (high 115/114 iTRAQ ratio) from the excitatory proteome, and vice versa for the inhibitory proteome. (C)-(E) Histograms that illustrate how Filters 1, 2, and 3 were applied. In (C) and (D), green shows the distribution of true positives. Red in (C) is the distribution of false positives. See also Figure S5 and Table S4.
Figure 4
Figure 4. Specificity and coverage of excitatory and inhibitory synaptic cleft proteomes
(A) Proteins of each proteomic list, subdivided by functional class. Genes in blue have no prior connection to synapses (i.e., they are synapse orphans), while genes with asterisks(*) have no prior connection to that specific synapse type (but are known to be generally synaptic). (B) Graphs showing the synapse specificity (left) and synapse subtype specificity (middle) of the two proteomic lists. Excit. refers to the excitatory proteome of 199 proteins, and Inhib. refers to the inhibitory cleft proteome of 42 proteins. For synapse subtype analysis, only proteins with literature annotation as excitatory/inhibitory/both are included in the analysis; non-annotated synaptic proteins are excluded. On the far right, proteins are classified according to their sub-synaptic localization. Further details provided in Table S1, Tabs 1 and 2. (C) Cartoon depicting well-established excitatory (left) and inhibitory (right) synapse proteins. Proteins are colored according to whether they were detected in our excitatory proteome (green), inhibitory proteome (red), both (striped), or neither (grey). Proteins with multiple isoforms are listed below; purple font indicates detection in both proteomes. (D) Scatter plot showing the separation of proteins by E/I (excitatory/inhibitory) ratio. All proteins detected in Experiment 2 are plotted, by biotinylation extent in the inhibitory cleft (y-axis) versus excitatory cleft (x-axis). Each protein is colored according to whether it is present in either final proteomic list. Points corresponding to some well-established inhibitory, excitatory, and dual-localized synaptic proteins are labeled. Dashed lines indicate the cut-offs applied to the data (Filter 1). See also Figure S5D for additional E/I scatter plots.
Figure 5
Figure 5. Imaging and synaptosome blotting of specific proteomic hits
(A) Table summarizing results. 10 synapse orphans (proteins without prior literature connection to synapses) from our excitatory synaptic cleft proteome were analyzed. Figure panels showing relevant data are given. (B) Colocalization of four synapse orphans with pre-synaptic marker Bassoon. Genes were fused at their N-terminal ends to HRP, and visualized by BxxP labeling followed by neutravidin-AlexaFluor647 staining. (C) Quantitation of data in (B). >8 fields of view were analyzed for each construct. HRP-LRRTM2 was a positive control analyzed in parallel, and GFP was a non-synapse localized negative control. Errors, ±1 s.e.m. (D) Colocalization of orphans in (B) with excitatory synapse marker vGlut1. (E) Immunoblot detection of 7 synapse orphans (blue) in purified synaptosomes (Syn) derived from adult rat brain. Tom20 and NeuN are negative controls. Fractions defined in (F). Red tracks the synaptosomes after each fractionation step. (G, H) Confocal imaging of endogenous Notch2 in DIV19 cultured neurons (G) and adult rat brain tissue (H) along with synapse marker Bassoon. All scale bars, 10 μm. See also Figure S6.
Figure 6
Figure 6. Mdga1 and Mdga2 have distinct synaptic localizations and functions
(A) Fluorescence imaging of HRP-Mdga2, via BxxP labeling and neutravidin-AlexaFlour647 staining. Values give colocalization extent with inhibitory (vGAT) and excitatory (vGlut1) synapse markers analyzed from 8 fields of view each; errors, ± 1 s.d.; scale bar, 10 m. (B) Synaptogenesis assay based on overexpression of Nlgn2 to probe specificity of presynaptic vesicle recruitment. Nlgn2 was overexpressed along with Venus fluorescent protein (top), Venus-Mdga1 (middle), or Venus-Mdga2 (bottom). Two fields of view are shown per condition. Enhanced recruitment of excitatory or inhibitory synaptic vesicles to transfected neurons was assessed by staining with anti-vGlut1 and anti-vGAT antibodies, respectively. Images are representative of >20 transfected neurons per condition. Controls show that co-overexpression of Mdga1 or Mdga2 does not alter surface levels of V5-Nlgn2 (data not shown). (C) Quantitation of data in (B) along with 7 additional fields of view per condition. Synapse density is defined as total anti-vGlut1 or anti-vGAT intensity divided by area of transfected neuron. Errors, ± s.e.m. (D) Effect of Mdga1 or Mdga2 overexpression (without Nlgn2 co-overexpression) on excitatory and inhibitory vesicle densities, quantified as in (C). 12 fields of view analyzed per condition. Errors, ± s.e.m. (E) Effect of single or double knockdown of Mdga1 and/or Mdga2 on excitatory and inhibitory vesicle densities, quantified as in (C). Knockdowns (from 3 technical replicates per condition) verified by qPCR in (F) (errors, ± s.e.m.). Representative images in Figure S7D. 15 fields of view analyzed per condition. Errors, ± s.e.m. (G) Chimeras of MDGA1 and MDGA2 tested in (H). The parent genes each have 6 immunoglobulin (Ig) domains, a fibronectin type III (FNIII) domain, a memprin/A5 protein/receptor tyrosine phosphatase mu (MAM) domain, and a C-terminal GPI anchor. Chimera B exhibited poor surface trafficking and was not evaluated further. Numbers refer to amino acid residues at cross-over points. (H) Relative localization of chimeras to excitatory versus inhibitory synapses, assessed by imaging with anti-vGlut1 and anti-vGAT staining (images and error values shown in Figure S7E). See also Figure S7.

Similar articles

Cited by

References

    1. Allen NJ, Bennett ML, Foo LC, Wang GX, Chakraborty C, Smith SJ, Barres BA. Astrocyte glypicans 4 and 6 promote formation of excitatory synapses via GluA1 AMPA receptors. Nature. 2012;486:410–414. - PMC - PubMed
    1. Bayés A, Collins MO, Croning MDR, van de Lagemaat LN, Choudhary JS, Grant SGN. Comparative study of human and mouse postsynaptic proteomes finds high compositional conservation and abundance differences for key synaptic proteins. PLoS One. 2012;7:e46683. - PMC - PubMed
    1. Biesemann C, Grønborg M, Luquet E, Wichert SP, Bernard V, Bungers SR, Cooper B, Varoqueaux F, Li L, Byrne JA, et al. Proteomic screening of glutamatergic mouse brain synaptosomes isolated by fluorescence activated sorting. EMBO J. 2014;33:157–170. - PMC - PubMed
    1. Boyken J, Grønborg M, Riedel D, Urlaub H, Jahn R, Chua JJE. Molecular profiling of synaptic vesicle docking sites reveals novel proteins but few differences between glutamatergic and GABAergic synapses. Neuron. 2013;78:285–297. - PubMed
    1. Chapman-Smith A, Cronan JE. In vivo enzymatic protein biotinylation. Biomol. Eng. 1999;16:119–125. - PubMed

Publication types

MeSH terms