. 2016 Aug 25;166(5):1324-1337.e11.
doi: 10.1016/j.cell.2016.07.040.

Absolute Quantification of Matrix Metabolites Reveals the Dynamics of Mitochondrial Metabolism

Affiliations

Absolute Quantification of Matrix Metabolites Reveals the Dynamics of Mitochondrial Metabolism

Walter W Chen et al. Cell. .

Abstract

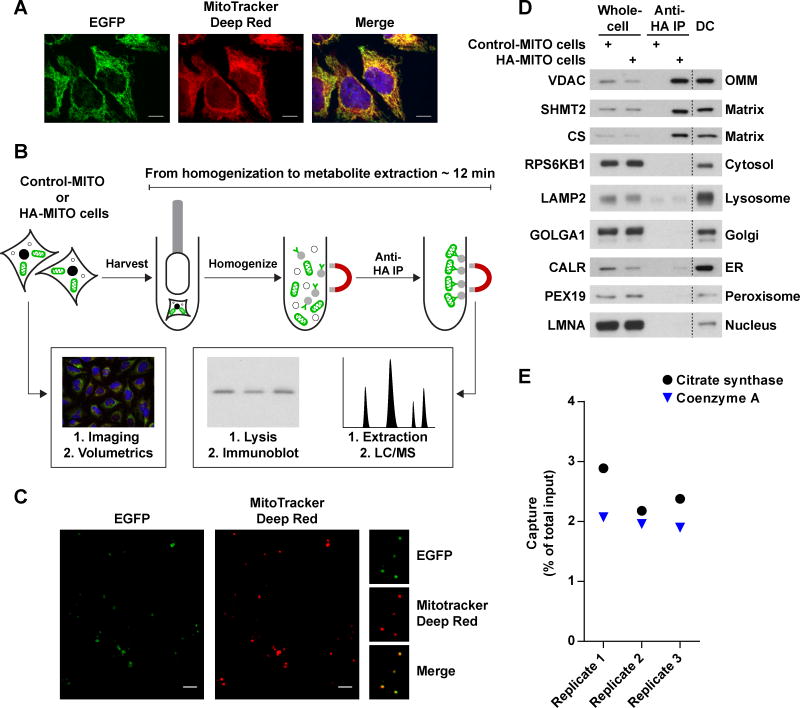
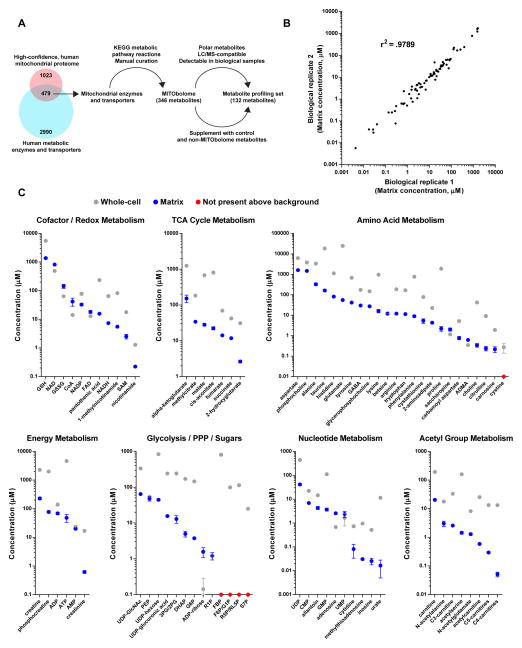
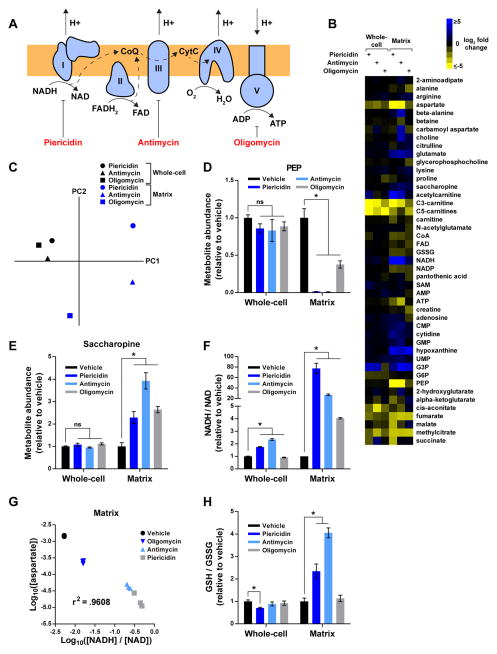
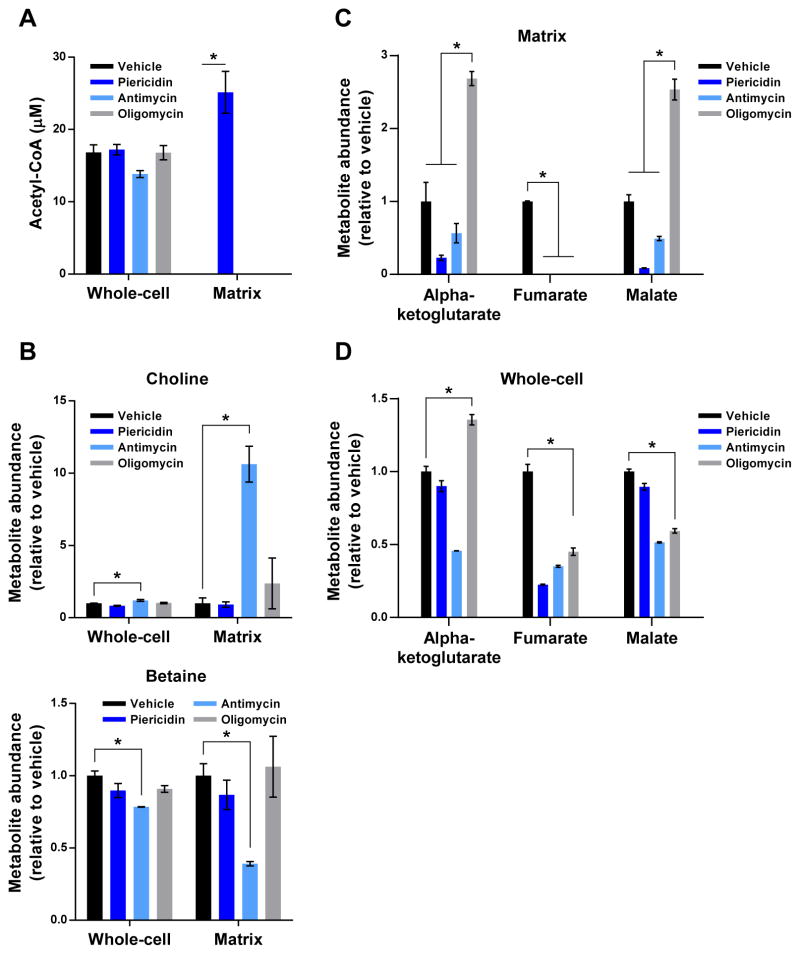
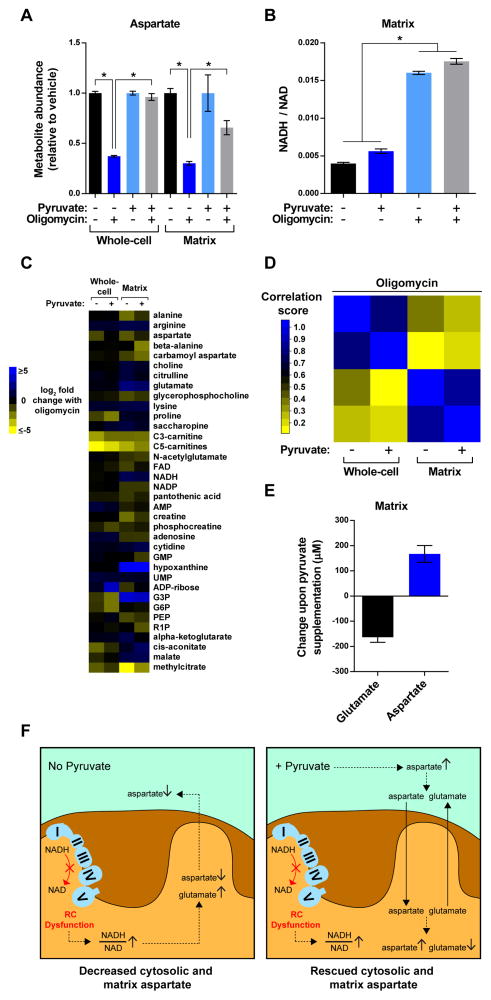
Mitochondria house metabolic pathways that impact most aspects of cellular physiology. While metabolite profiling by mass spectrometry is widely applied at the whole-cell level, it is not routinely possible to measure the concentrations of small molecules in mammalian organelles. We describe a method for the rapid and specific isolation of mitochondria and use it in tandem with a database of predicted mitochondrial metabolites ("MITObolome") to measure the matrix concentrations of more than 100 metabolites across various states of respiratory chain (RC) function. Disruption of the RC reveals extensive compartmentalization of mitochondrial metabolism and signatures unique to the inhibition of each RC complex. Pyruvate enables the proliferation of RC-deficient cells but has surprisingly limited effects on matrix contents. Interestingly, despite failing to restore matrix NADH/NAD balance, pyruvate does increase aspartate, likely through the exchange of matrix glutamate for cytosolic aspartate. We demonstrate the value of mitochondrial metabolite profiling and describe a strategy applicable to other organelles.


Figures

Figure 1
Figure 1. see also Figure S1: A method for the rapid and specific isolation of intact mitochondria
(A) The 3XTag-EGFP-OMP25 protein properly localizes to mitochondria. Representative confocal micrographs of HeLa cells expressing the recombinant EGFP-fusion protein (green). Mitochondria and nuclei were stained with MitoTracker Deep Red FM (red) and Hoechst (blue), respectively. Scale bars, 10 μm. (B) Workflow for the absolute quantification of matrix metabolites. Cells expressing Control-MITO (Control-MITO cells) or HA-MITO (HA-MITO cells) are rapidly harvested and dounce homogenized. HA-tagged mitochondria are isolated with a 3.5 minute IP, washed, and then lysed for immunoblot analysis to determine the amount of captured mitochondria or extracted for LC/MS-based metabolomics to quantify metabolites. Confocal microscopy and volumetric analysis of the HA-MITO-expressing cells are used to determine total mitochondrial volume per cell, which is then adjusted based on the percentage of mitochondrial volume occupied by the matrix (~63.16% of mitochondrial volume = matrix) (Gerencser et al., 2012). All of these measurements are combined to calculate the matrix concentration of a metabolite. (C) Epitope-tagged mitochondria isolated from cells incubated with MitoTracker Deep Red FM retain the dye. Representative confocal micrographs of beads with isolated mitochondria (green) and MitoTracker Deep Red FM signal (red). On the right are magnifications of several beads with mitochondria. Scale bars, 5 μm. (D) Purification of epitope-tagged mitochondria has significantly less organellar contamination compared to a differential centrifugation method optimized for speed. Immunoblot analysis of whole-cell lysates (Whole-cell) and lysates of mitochondria purified with anti-HA beads (Anti-HA IP) or differential centrifugation (DC). Lysates were derived from cells expressing Control-MITO (Control-MITO cells) or HA-MITO (HA-MITO cells). The names of the protein markers used are to the left of the blots and their corresponding subcellular compartments to the right. OMM, outer mitochondrial membrane; matrix, mitochondrial matrix; Golgi, Golgi complex; ER, endoplasmic reticulum. (E) Epitope-tagged mitochondria retain both soluble proteins and small molecules to similar degrees. A comparison of the amount of captured mitochondria as assessed by a matrix protein (Citrate synthase) and a matrix metabolite (Coenzyme A). Data are represented as a percentage of the total material present in harvested cells. Cells were cultured in DMEM without pyruvate.
Figure 2
Figure 2. see also Figure S2, Table S1: Identities and concentrations of matrix metabolites in human mitochondria
(A) Generation of the MITObolome and the set of 132 metabolites for which concentrations were measured. Mitochondrial proteomic data was cross-referenced with a list of all human metabolic enzymes and transporters. The overlap between these two data sets was used in conjunction with KEGG and manual curation to assemble the MITObolome, a list of all predicted metabolites within mitochondria. The MITObolome was filtered on the indicated criteria and supplemented with additional metabolites to generate the final set of 132 metabolites for which concentrations were measured. KEGG, Kyoto Encyclopedia of Genes and Genomes. (B) Absolute quantification of matrix metabolites is highly consistent between experiments. Matrix concentrations of metabolites from two biological replicates were compared and a Pearson correlation coefficient was calculated. (C) Concentrations of metabolites in the mitochondrial matrix and whole-cells. Data are from cells cultured in DME base media (mean ± SEM, n = 3). For each group, metabolites are arranged from most abundant to least abundant within mitochondria. Metabolites not considered to be present at levels above background are plotted as red dots on the x-axis. See Table S1 for the full names of certain abbreviated metabolites. PPP, pentose phosphate pathway.
Figure 3
Figure 3. see also Table S2: The compartmentalized dynamics of matrix metabolites during RC dysfunction
(A) Schematic depicting the function of each RC component and the corresponding sites of inhibition for piericidin, antimycin, and oligomycin. Complexes I–IV transfer high- energy reducing equivalents from NADH and FADH2 to O2, generating a proton gradient in the process. Complex V utilizes this gradient to synthesize ATP. CoQ, coenzyme Q; CytC, cytochrome C. (B) Heat map representing changes in metabolite concentrations upon inhibition of Complex I, III, or V, as assessed by whole-cell and mitochondrial metabolomics. For each metabolite and inhibitor, the mean log2-transformed fold change is relative to the corresponding whole-cell or matrix concentration of vehicle-treated cells (n = 3). To be included in the heat map, metabolites had to change at least 2-fold upon inhibition of an RC complex. See Table S2 for additional criteria used to generate this heat map and for the concentrations of all metabolites. (C) Whole-cell and matrix profiles during RC dysfunction are substantially different. Principal component analysis of metabolite changes in Figure 3B as assessed by profiling of the mitochondrial matrix (blue) or whole-cells (black). (D) RC inhibition lowers matrix PEP. (E) RC inhibition increases matrix saccharopine. (F) The NADH/NAD imbalance during RC dysfunction is more pronounced in the matrix than on the whole-cell level. (G) The relationship between matrix aspartate and the matrix NADH/NAD ratio can be modeled as a power function. Log10-transformed values of matrix aspartate concentrations (units of M) and NADH/NAD ratios were compared across different states of RC function and a Pearson correlation coefficient was calculated. (H) Inhibition of Complexes I and III increases matrix GSH/GSSG ratios. For all panels, unless indicated otherwise, all experiments were performed in DMEM without pyruvate and all measurements are normalized to the corresponding whole-cell or matrix concentrations of vehicle-treated cells (mean ± SEM, n = 3, *p < 0.05).
Figure 4
Figure 4. see also Figure S3: Hallmarks of matrix metabolism under different forms of RC inhibition
(A) Matrix acetyl-CoA only accumulates during Complex I inhibition. Data are represented as whole-cell or matrix concentrations that have not been normalized. (B) Complex III dysfunction inhibits the transformation of choline to betaine in the matrix. (C) Complex V inhibition leads to the accumulation of matrix metabolites at opposite ends of the TCA cycle. (D) The pattern of changes seen in matrix TCA cycle metabolites during Complex V inhibition is not recapitulated at the whole-cell level. For all panels, unless indicated otherwise, all experiments were performed in DMEM without pyruvate and all measurements are normalized to the corresponding whole-cell or matrix concentrations of vehicle-treated cells (mean ± SEM, n = 3, *p < 0.05).
Figure 5
Figure 5. see also Figure S4, Table S3: Amelioration of RC dysfunction with pyruvate increases matrix aspartate without restoration of the matrix NADH/NAD ratio
(A) Pyruvate can ameliorate loss of aspartate during Complex V blockade both in whole-cells and the mitochondrial matrix. All measurements are normalized to the corresponding whole-cell or matrix concentrations of vehicle-treated cells. (B) Pyruvate does not ameliorate matrix NADH/NAD imbalance during Complex V dysfunction. Data are presented as NADH/NAD ratios that have not been normalized. (C) Heat map representing changes in metabolite concentrations upon inhibition of Complex V in the presence and absence of pyruvate, as assessed by whole-cell and mitochondrial metabolomics. For each metabolite, the mean log2-transformed fold change is relative to the corresponding whole-cell or matrix concentration of vehicle-treated cells in the absence or presence of pyruvate (n = 3). To be included in the heat map, metabolites had to change at least 2-fold upon inhibition of Complex V. See Table S3 for additional criteria used to generate this heat map and for the concentrations of all metabolites. (D) Pyruvate supplementation has limited effects on the metabolite contents of whole-cells and the mitochondrial matrix during Complex V blockade. A Pearson correlation matrix of the metabolic changes in Figure 5C. (E) During Complex V inhibition, pyruvate supplementation leads to a reduction in matrix glutamate similar in magnitude to the increase in matrix aspartate. Data are presented as matrix concentrations that have not been normalized. See the Methods and Resources for the details of these calculations. For all panels, unless indicated otherwise, experiments were performed in DMEM with and without pyruvate (1 mM) and measurements are presented as the mean ± SEM, n = 3, *p < 0.05. (F) Model illustrating the effects of pyruvate on cytosolic and matrix aspartate during RC dysfunction.

Comment in

Similar articles

Cited by

References

    1. Berry MN, Barritt GJ, Edwards AM, Burdon RH. Isolated Hepatocytes: Preparation, Properties and Applications: Preparation, Properties and Applications. Elsevier Science; 1991.
    1. Berthet J, Baudhuin P. A REMARK ABOUT THE DETERMINATION OF THE WATER CONTENT OF MITOCHONDRIA. The Journal of Cell Biology. 1967;34:701–702. - PMC - PubMed
    1. Bestwick RK, Moffett GL, Mathews CK. Selective expansion of mitochondrial nucleoside triphosphate pools in antimetabolite-treated HeLa cells. Journal of Biological Chemistry. 1982;257:9300–9304. - PubMed
    1. Birsoy K, Wang T, Chen Walter W, Freinkman E, Abu-Remaileh M, Sabatini David M. An Essential Role of the Mitochondrial Electron Transport Chain in Cell Proliferation Is to Enable Aspartate Synthesis. Cell. 2015;162:540–551. - PMC - PubMed
    1. Bogenhagen D, Clayton DA. The Number of Mitochondrial Deoxyribonucleic Acid Genomes in Mouse L and Human HeLa Cells: QUANTITATIVE ISOLATION OF MITOCHONDRIAL DEOXYRIBONUCLEIC ACID. Journal of Biological Chemistry. 1974;249:7991–7995. - PubMed

Publication types