. 2016 Oct:151:122-33.
doi: 10.1016/j.exer.2016.08.008. Epub 2016 Aug 23.

AMD-like retinopathy associated with intravenous iron

Affiliations

AMD-like retinopathy associated with intravenous iron

Delu Song et al. Exp Eye Res. 2016 Oct.

Abstract

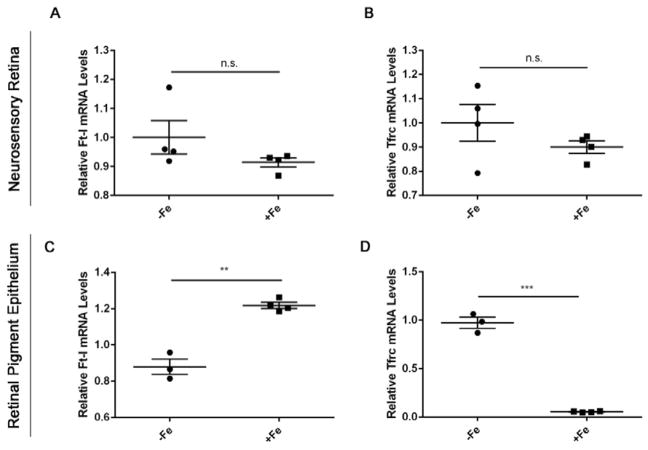
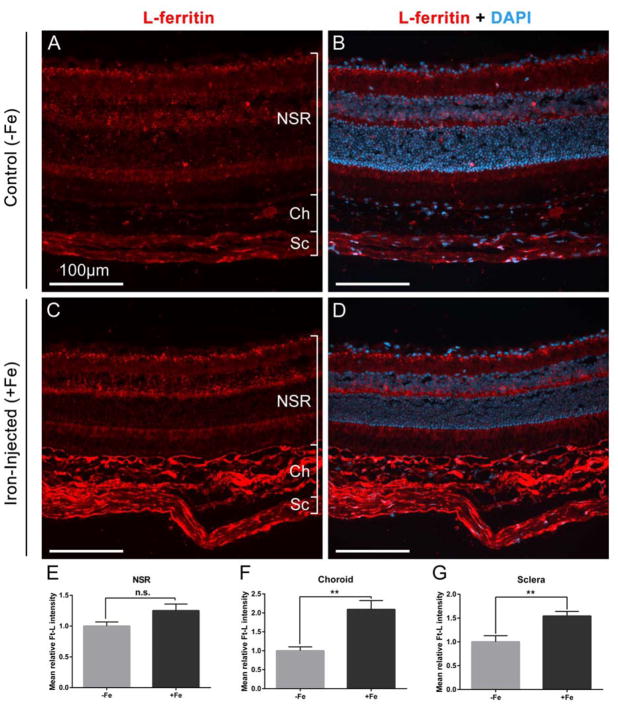
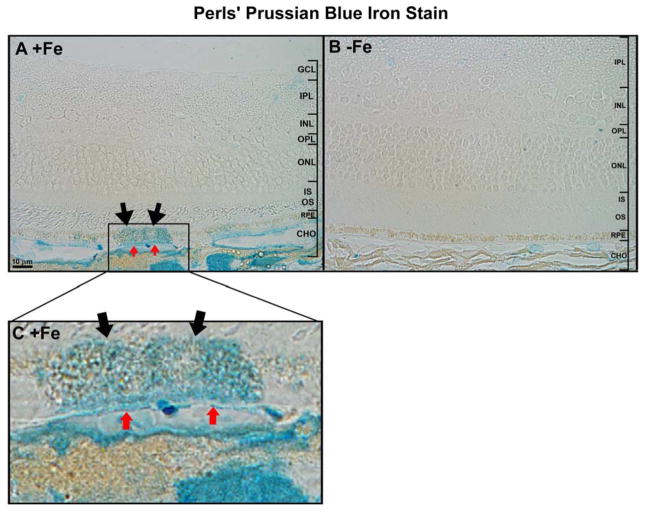
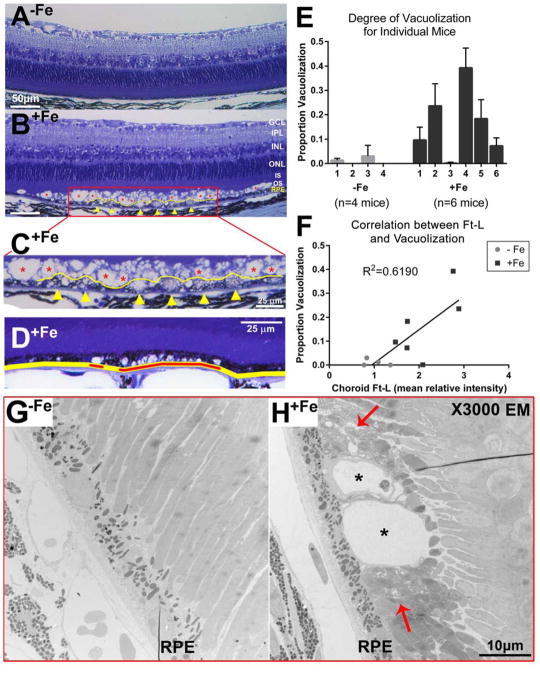
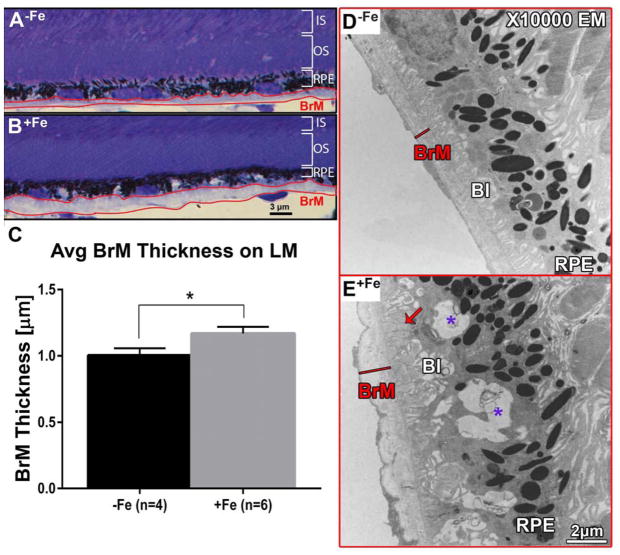
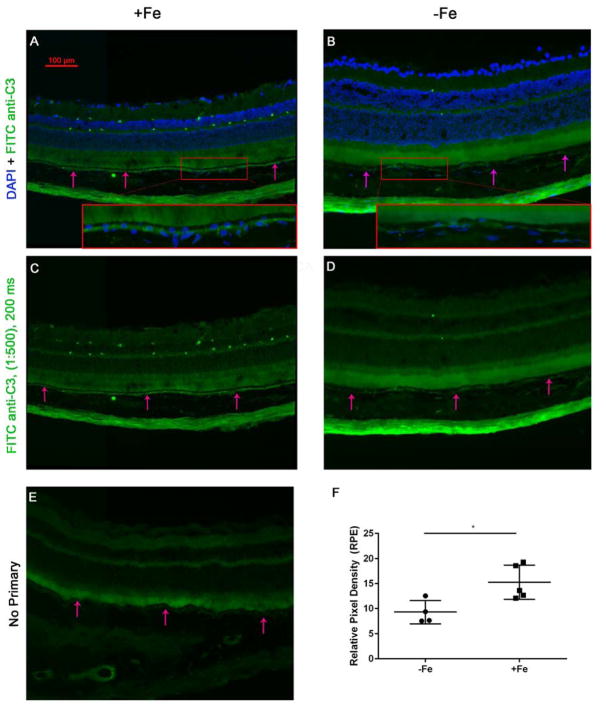
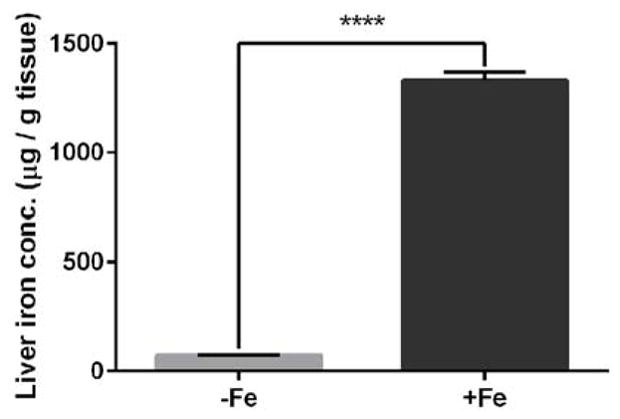
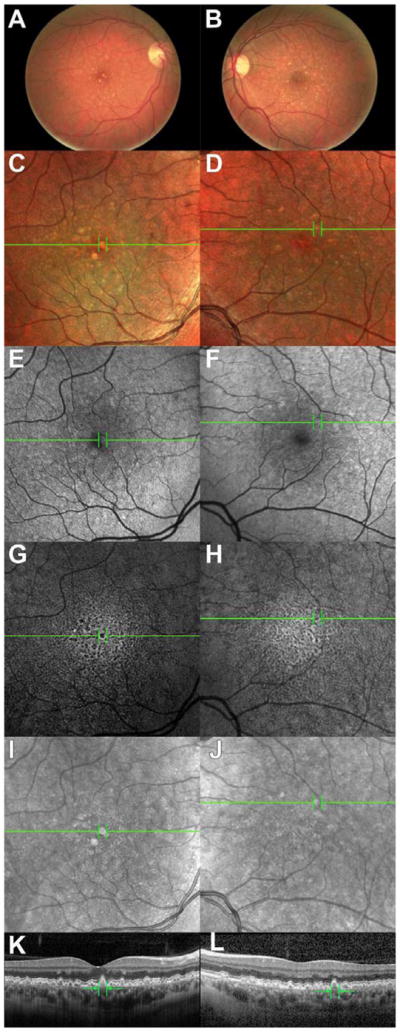
Iron accumulation in the retina is associated with the development of age-related macular degeneration (AMD). IV iron is a common method to treat iron deficiency anemia in adults, and its retinal manifestations have not hitherto been identified. To assess whether IV iron formulations can be retina-toxic, we generated a mouse model for iron-induced retinal damage. Male C57BL/6J mice were randomized into groups receiving IV iron-sucrose (+Fe) or 30% sucrose (-Fe). Iron levels in neurosensory retina (NSR), retinal pigment epithelium (RPE), and choroid were assessed using immunofluorescence, quantitative PCR, and the Perls' iron stain. Iron levels were most increased in the RPE and choroid while levels in the NSR did not differ significantly in +Fe mice compared to controls. Eyes from +Fe mice shared histological features with AMD, including Bruch's membrane (BrM) thickening with complement C3 deposition, as well as RPE hypertrophy and vacuolization. This focal degeneration correlated with areas of high choroidal iron levels. Ultrastructural analysis provided further detail of the RPE/photoreceptor outer segment vacuolization and Bruch's membrane thickening. Findings were correlated with a clinical case of a 43-year-old patient who developed numerous retinal drusen, the hallmark of AMD, within 11 months of IV iron therapy. Our results suggest that IV iron therapy may have the potential to induce or exacerbate a form of retinal degeneration. This retinal degeneration shares features with AMD, indicating the need for further study of AMD risk in patients receiving IV iron treatment.

Keywords: AMD; Iron; Macular degeneration; Oxidative stress; RPE.


Conflict of interest statement

No authors have conflicts of interest.

Figures

Figure 1
Figure 1. Iron accumulates in the RPE but not neurosensory retinas of mice aged 10 weeks following 2 weekly IV iron-sucrose injections
Ferritin light chain (Ft-l) and transferrin receptor (Tfrc) were used as measures of iron levels within the retinas. Quantitative PCR results of Ft-l and Tfrc are shown for the neurosensory retina (A, B) and RPE (C, D). mRNA levels of Ft-l and Tfrc in the NSR remain unchanged post IV iron injections. However, Ft-L mRNA expression increased (**) within RPE demonstrating iron overload, while Tfrc correspondingly decreased. Statistical analysis was performed using an Unpaired Student’s T-test for +Fe (n=5) vs. − Fe (n=4). Bars indicate mean ± SEM. P values were labeled as non-significant “n.s.”, (p > 0.05), * (p < 0.05), ** (p < 0.001), *** (p < 0.0001).
Figure 2
Figure 2. Immunofluorescence of ferritin in mouse retinas
Comparison of frozen retinal sections from mice after 12 injections of sucrose (30%) (A,B) or 1.2 mg iron-sucrose (C,D), stained for ferritin with anti-Ft-L (red) and DAPI to stain nuclei (blue). Scale bars indicate 100 μm. (E-G) Ft-L fluorescent signal quantification from neurosensory retinal (NSR), choroid (Ch), and scleral (Sc) layers in iron-injected mice (+Fe, n=6) and normalized with respect to signal in the control mice (−Fe, n=5). Statistical analysis was performed using an Unpaired Student’s T-test. P values were labeled as non-significant “n.s.”, ** (p < 0.001).
Figure 3
Figure 3. Perls’ iron staining in mouse retinas
Plastic sections stained with Perls’ Prussian blue stain after 12 IV injections of iron-sucrose (A) and after 12 IV injections of sucrose (B). (C) Magnification of the area of interest in (A). Focal areas of increased iron staining were seen in iron-injected mice in the RPE (black arrows in A,C), Bruch’s membrane (red arrows in A,C) and choroidal vasculature. No focal staining was seen in the control mouse. Scale bars indicate 10 μm.
Figure 4
Figure 4. Vacuolization as a component of retinal degeneration in mice following IV iron injections
Toluidene blue staining of plastic sections of mouse retinas. (A) An area of normal mouse retina from a mouse receiving 12 injections of sucrose is compared to (B) an area of degeneration seen in a mouse receiving 12 injections of 1.2 mg iron-sucrose. GCL: ganglion cell layer. IPL: inner plexiform layer. INL: inner nuclear layer. ONL: outer nuclear layer. IS, OS: inner, outer segments of the photoreceptors. RPE: retinal pigment epithelium. (C) Magnification of the area of interest in (B). Vacuolization is evident in the outer segment layer (red asterisks in B,C) and RPE cells (yellow arrow heads in B,C). RPE cell hypertrophy (yellow line in B,C) is also apparent. Layers above the outer segment appear normal. Scale bars indicate 50 μm in (A) and (B), and 25 μm in (C) and (D). (D) RPE was marked if it was either directly affected by vacuolization and/or adjacent to photoreceptors that were affected by vacuolization (red lines). The sum of the lengths of these affected RPE sections in a single image (red lines) was then divided by the total length of the RPE in that image (yellow line) to calculate (E) the proportion of RPE affected by vacuolization for individual mice. Bars indicate mean ± SEM. (F) The proportion of the retina affected by RPE/photoreceptor vacuolization for each eye compared to the corresponding choroidal Ft-L signal. Data from mice after 12 injections of sucrose (−Fe) or 1.2 mg iron-sucrose (+Fe) were plotted vs choroidal Ft-L signal. Linear regression analysis was performed to find a single line of best fit for both sets of data. (G) Electron micrograph at 3000x magnification showing no vacuolization in a −Fe eye. (H) Comparison micrograph in a +Fe eye showing vacuolization in the apical RPE (black asterisks) surrounded by disorganized photoreceptor outer segments (red arrows). RPE: retinal pigment epithelium. Scale bar indicates 10 μm.
Figure 5
Figure 5. Bruch’s membrane thickening on light microscopy
(A) Example of BrM (outlined in red) in control group (−Fe). (B) BrM of experimental group (+Fe) displaying increased thickness. Scale bar indicates 3 μm. (C) Average BrM thickness of +Fe mice (n=6) is significantly increased relative to −Fe mice (n=4). Statistical analysis was performed using an Unpaired Student’s T-test. Bars indicate mean ± SEM. P value was labeled as * for (p < 0.05). (D) Electron micrograph at 10000x magnification showing a uniform and thin BrM (red line) and basal infolding of the RPE in a −Fe eye. (E) Comparison micrograph in a +Fe eye showing an irregular and relatively thicker BrM (red line), and deposit formation between BrM and the RPE (red arrow). Purple asterisks indicate mid-cytoplasmic vacuolization basal to RPE melanosomes. BrM: Bruch’s membrane. BI: basal infolding; RPE: retinal pigment epithelium. Scale bar indicates 2 μm.
Figure 6
Figure 6. IV iron injections in the murine model lead to sub-RPE complement (C3) accumulation
(A) Fluorescence photomicrograph of anti-C3 immunofluorescence in IV iron-injected eyes (+Fe) in the murine model following 12 injections of 1.2 mg/ 200 ul iron sucrose solution. A magnified inset is provided (red box). Arrows indicate RPE. (B) DAPI and FITC anti-C3 staining in the IV sucrose injected control group (−Fe) receiving 300 mg of sucrose, with magnified inset. (C) FITC- anti-C3 immunostaining displays significant sub-RPE C3 within the +Fe group as compared to the −Fe group, shown in (D) with minimal C3 deposition. (E) No primary antibody representative image. (F) Pixel density analysis of FITC anti-C3 intensity within the RPE indicates an elevation in C3 intensity within the +Fe group. Statistical analysis was performed using an Unpaired Student’s T-test for +Fe (n=5) vs. − Fe (n=4). P value was labeled as * (p < 0.05).
Figure 7
Figure 7. qPCR of murine liver indicates systemic effects after IV iron-sucrose injections
Iron concentration in liver tissue based on wet weight in mice after 12 injections of either sucrose (30%) (−Fe) or 1.2 mg iron-sucrose (+Fe), as measured by the bathophenanthroline protocol. Statistical analysis was performed using an Unpaired Student’s T-test.). P value was labeled **** (p < 0.0001). Bars indicate mean ± SEM.
Figure 8
Figure 8. Multimodal patient imaging
Color fundus photographs of the (A) right and (B) left eyes demonstrating multiple medium- and small-sized drusen, as well as a few large drusen. (C,D): MultiColor imaging in (C) right and (D) left eyes demonstrating multiple drusen as seen in fundus photography. (E,F): SW-AF images demonstrating areas of abnormal autofluorescence in (E) right and (F) left eyes. (G,H): IR-AF images demonstrating areas of abnormal autofluorescence in (G) right and (H) left eyes. IRAF and to a lesser extent SW-AF demonstrate areas of hypo-autofluorescence surrounded by relative hyperautofluorescence corresponding to positions of drusen. (I–L): IR reflectance and SD-OCT images of (I,K) right and (J,L) left eye demonstrating areas of medium and large size drusen as well as a “sawtoothed” baseline. Green lines (A–J) indicate the cross-section represented in (K–L). All images are from approximately 3.5 years after the patient’s initial presentation.

Similar articles

Cited by

References

    1. Age-Related Eye Disease Study 2 Research Group. Lutein + zeaxanthin and omega-3 fatty acids for age-related macular degeneration: the Age-Related Eye Disease Study 2 (AREDS2) randomized clinical trial. JAMA. 2013;309:2005–2015. doi: 10.1001/jama.2013.4997. - DOI - PubMed
    1. Anderson DH, Mullins RF, Hageman GS, Johnson LV. A role for local inflammation in the formation of drusen in the aging eye. Am J Ophthalmol. 2002;134:411–431. doi: 10.1016/S0002-9394(02)01624-0. - DOI - PubMed
    1. Barry M. Liver iron concentration, stainable iron, and total body storage iron. Gut. 1974;15:411–415. - PMC - PubMed
    1. Bhoiwala DL, Song Y, Cwanger A, Clark E, Zhao L-L, Wang C, Li Y, Song D, Dunaief JL. CD1 Mouse Retina Is Shielded From Iron Overload Caused by a High Iron Diet. Invest Ophthalmol Vis Sci. 2015;56:5344–5352. doi: 10.1167/iovs.15-17026. - DOI - PMC - PubMed
    1. Biesemeier A, Yoeruek E, Eibl O, Schraermeyer U. Iron accumulation in Bruch’s membrane and melanosomes of donor eyes with age-related macular degeneration. Exp Eye Res. 2015;137:39–49. - PubMed

MeSH terms