

Molecular fingerprinting delineates progenitor populations in the developing zebrafish enteric nervous system
- PMID: 27565577
- PMCID: PMC5088718
- DOI: 10.1002/dvdy.24438
Molecular fingerprinting delineates progenitor populations in the developing zebrafish enteric nervous system
Abstract
Background: To understand the basis of nervous system development, we must learn how multipotent progenitors generate diverse neuronal and glial lineages. We addressed this issue in the zebrafish enteric nervous system (ENS), a complex neuronal and glial network that regulates essential intestinal functions. Little is currently known about how ENS progenitor subpopulations generate enteric neuronal and glial diversity.
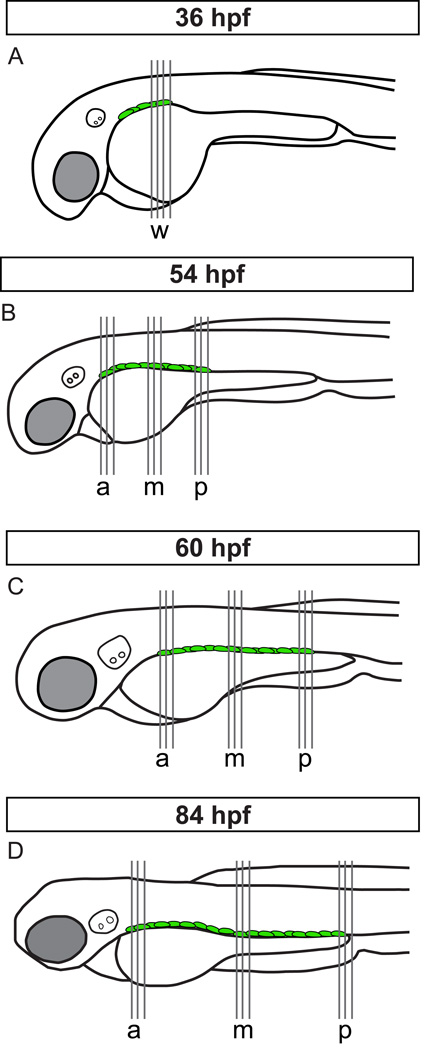
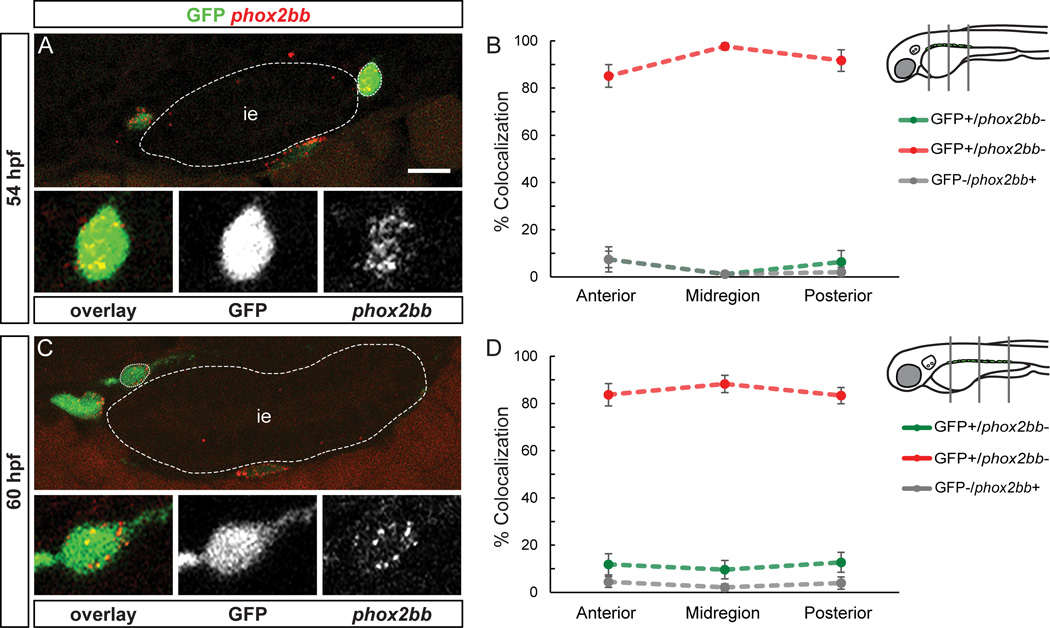
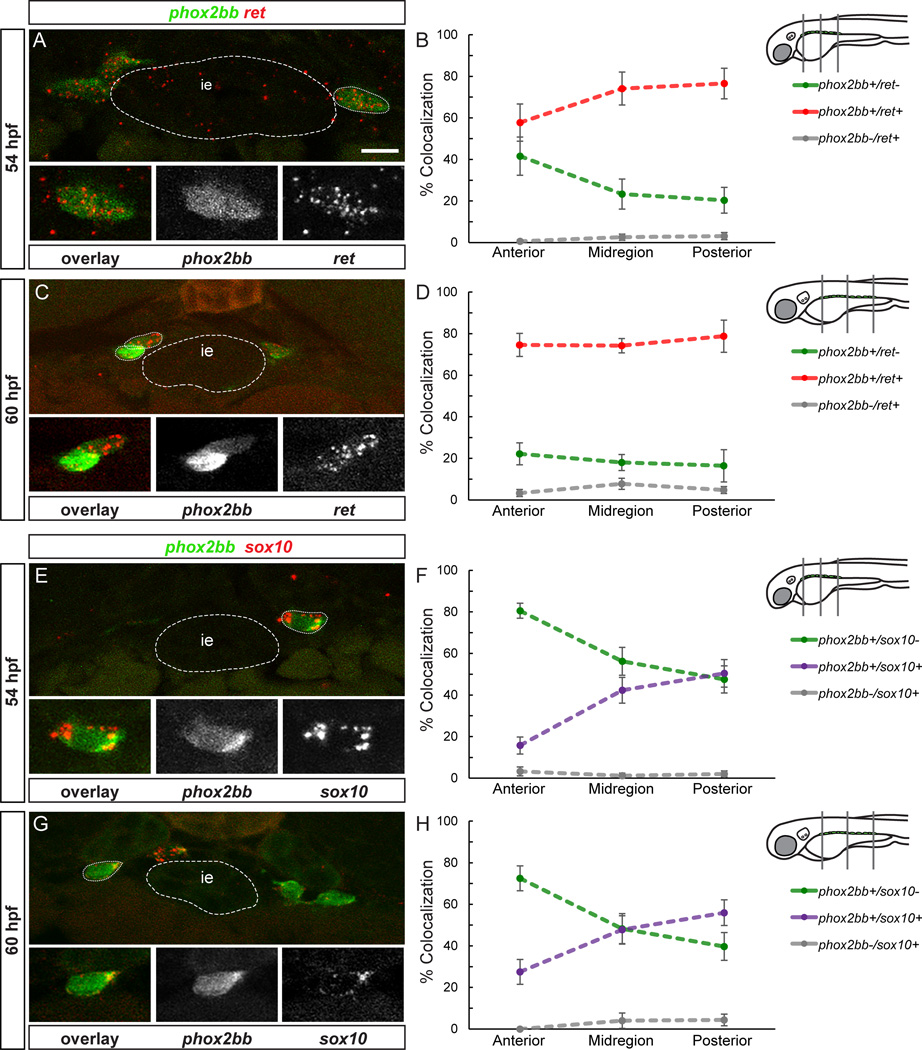
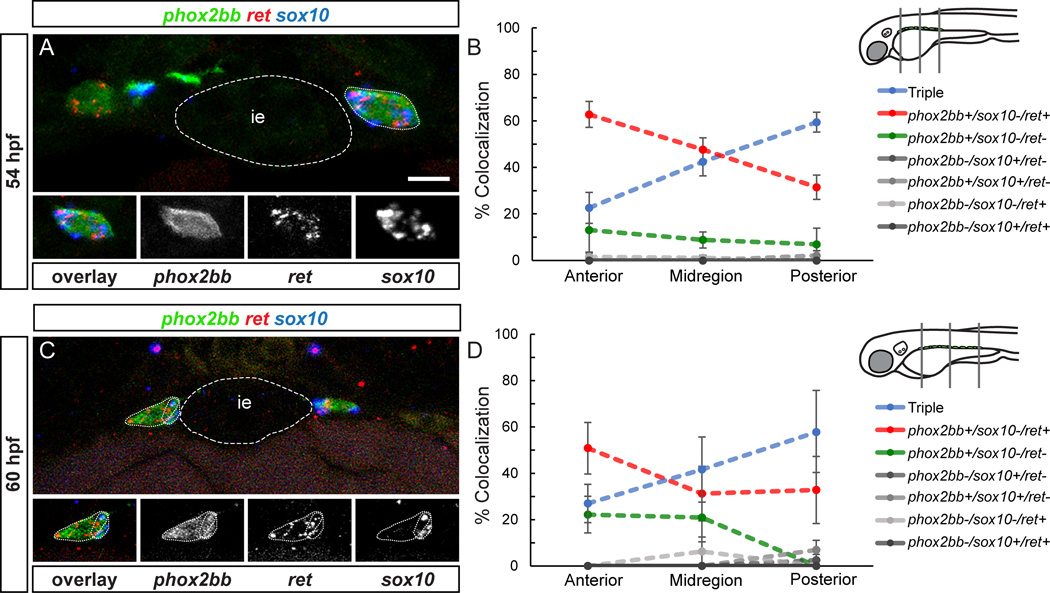
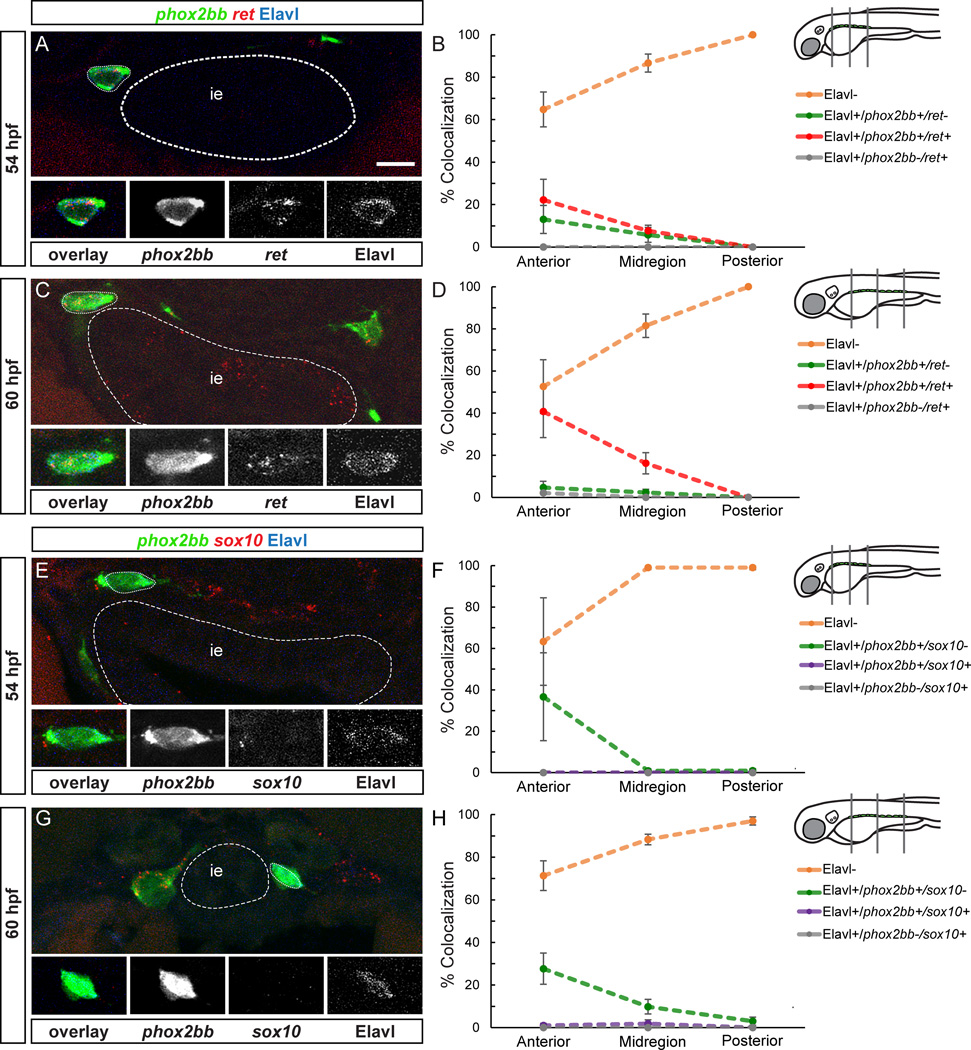
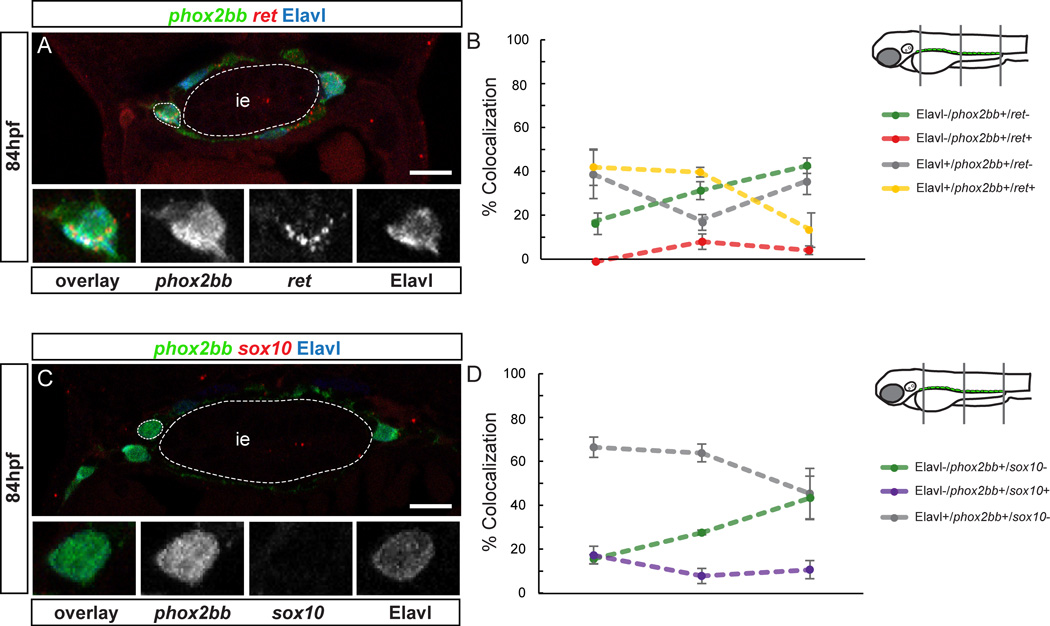
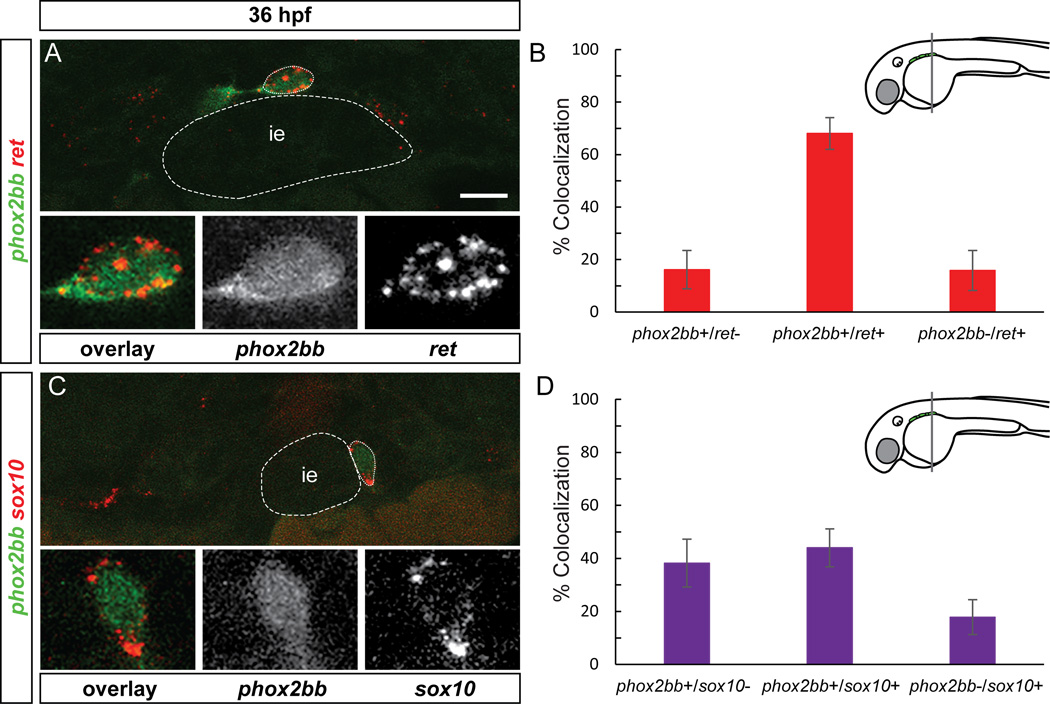
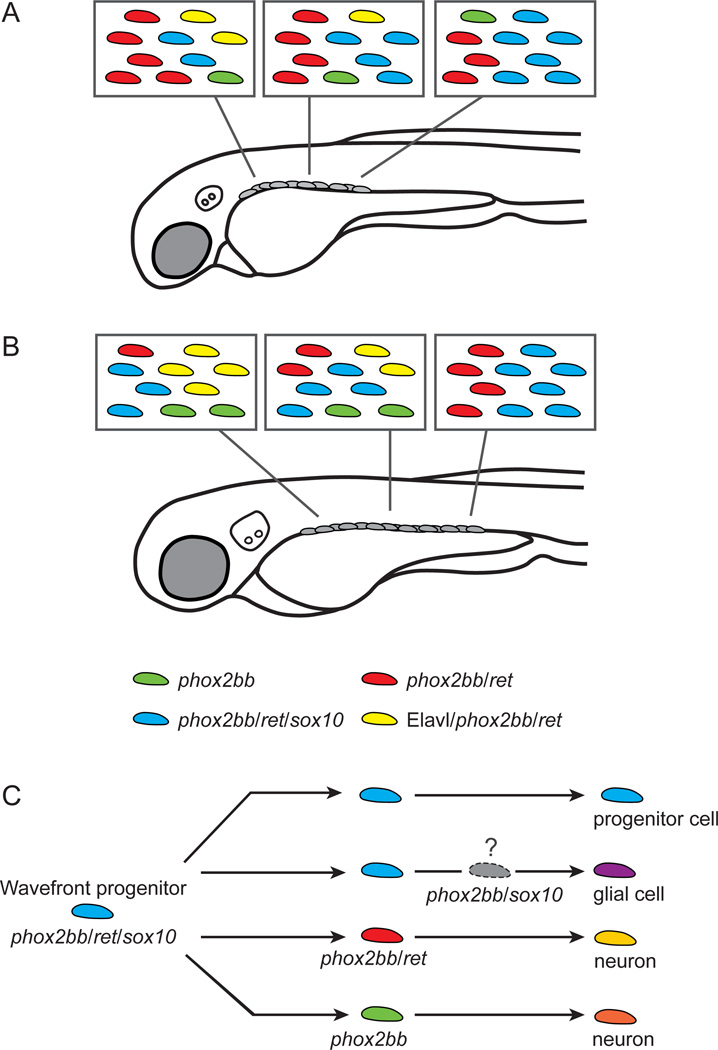
Results: We identified temporally and spatially dependent progenitor subpopulations based on coexpression of three genes essential for normal ENS development: phox2bb, sox10, and ret. Our data suggest that combinatorial expression of these genes delineates three major ENS progenitor subpopulations, (1) phox2bb + /ret- /sox10-, (2) phox2bb + /ret + /sox10-, and (3) phox2bb + /ret + /sox10+, that reflect temporal progression of progenitor maturation during migration. We also found that differentiating zebrafish neurons maintain phox2bb and ret expression, and lose sox10 expression.
Conclusions: Our data show that zebrafish enteric progenitors constitute a heterogeneous population at both early and late stages of ENS development and suggest that marker gene expression is indicative of a progenitor's fate. We propose that a progenitor's expression profile reveals its developmental state: "younger" wave front progenitors express all three genes, whereas more mature progenitors behind the wave front selectively lose sox10 and/or ret expression, which may indicate developmental restriction. Developmental Dynamics 245:1081-1096, 2016. © 2016 Wiley Periodicals, Inc.
Keywords: development; enteric glia; enteric neuron; gene expression; neural crest.
© 2016 Wiley Periodicals, Inc.
Figures
Similar articles
-
BMP signaling pathway member expression is enriched in enteric neural progenitors and required for zebrafish enteric nervous system development.Dev Dyn. 2025 Mar;254(3):272-287. doi: 10.1002/dvdy.737. Epub 2024 Sep 19. Dev Dyn. 2025. PMID: 39297504
-
Depletion of the IKBKAP ortholog in zebrafish leads to hirschsprung disease-like phenotype.World J Gastroenterol. 2015 Feb 21;21(7):2040-6. doi: 10.3748/wjg.v21.i7.2040. World J Gastroenterol. 2015. PMID: 25717236 Free PMC article.
-
The role of SOX10 during enteric nervous system development.Dev Biol. 2013 Oct 1;382(1):330-43. doi: 10.1016/j.ydbio.2013.04.024. Epub 2013 May 2. Dev Biol. 2013. PMID: 23644063 Review.
-
Transcription and Signaling Regulators in Developing Neuronal Subtypes of Mouse and Human Enteric Nervous System.Gastroenterology. 2018 Feb;154(3):624-636. doi: 10.1053/j.gastro.2017.10.005. Epub 2017 Oct 12. Gastroenterology. 2018. PMID: 29031500 Free PMC article.
-
Gut feelings: Studying enteric nervous system development, function, and disease in the zebrafish model system.Dev Dyn. 2018 Feb;247(2):268-278. doi: 10.1002/dvdy.24597. Epub 2017 Oct 23. Dev Dyn. 2018. PMID: 28975691 Review.
Cited by
-
A New Transgenic Tool to Study the Ret Signaling Pathway in the Enteric Nervous System.Int J Mol Sci. 2022 Dec 10;23(24):15667. doi: 10.3390/ijms232415667. Int J Mol Sci. 2022. PMID: 36555308 Free PMC article.
-
Enteric neural crest development in Astyanax mexicanus surface fish and cavefish.Differentiation. 2025 Jul-Aug;144:100881. doi: 10.1016/j.diff.2025.100881. Epub 2025 Jun 13. Differentiation. 2025. PMID: 40554892
-
Who's talking to whom: microbiome-enteric nervous system interactions in early life.Am J Physiol Gastrointest Liver Physiol. 2023 Mar 1;324(3):G196-G206. doi: 10.1152/ajpgi.00166.2022. Epub 2023 Jan 10. Am J Physiol Gastrointest Liver Physiol. 2023. PMID: 36625480 Free PMC article. Review.
-
A targeted CRISPR-Cas9 mediated F0 screen identifies genes involved in establishment of the enteric nervous system.bioRxiv [Preprint]. 2023 Dec 29:2023.12.28.573581. doi: 10.1101/2023.12.28.573581. bioRxiv. 2023. Update in: PLoS One. 2024 May 29;19(5):e0303914. doi: 10.1371/journal.pone.0303914. PMID: 38234831 Free PMC article. Updated. Preprint.
-
BMP signaling pathway member expression is enriched in enteric neural progenitors and required for zebrafish enteric nervous system development.Dev Dyn. 2025 Mar;254(3):272-287. doi: 10.1002/dvdy.737. Epub 2024 Sep 19. Dev Dyn. 2025. PMID: 39297504
References
-
- Anderson RB, Stewart AL, Young HM. Phenotypes of neural-crest-derived cells in vagal and sacral pathways. Cell and tissue research. 2006;323:11–25. - PubMed
-
- Baloh RH, Tansey MG, Golden JP, Creedon DJ, Heuckeroth RO, Keck CL, Zimonjic DB, Popescu NC, Johnson EM, Jr, Milbrandt J. TrnR2, a novel receptor that mediates neurturin and GDNF signaling through Ret. Neuron. 1997;18:793–802. - PubMed
-
- Baloh RH, Tansey MG, Lampe PA, Fahrner TJ, Enomoto H, Simburger KS, Leitner ML, Araki T, Johnson EM, Jr, Milbrandt J. Artemin, a novel member of the GDNF ligand family, supports peripheral and central neurons and signals through the GFRalpha3-RET receptor complex. Neuron. 1998;21:1291–1302. - PubMed
-
- Bisgrove BW, Raible DW, Walter V, Eisen JS, Grunwald DJ. Expression of c-ret in the zebrafish embryo: Potential roles in motoneuronal development. J Neurobiol. 1997;33:749–768. - PubMed
-
- Bondurand N, Natarajan D, Barlow A, Thapar N, Pachnis V. Maintenance of mammalian enteric nervous system progenitors by SOX10 and endothelin 3 signalling. Development. 2006;133:2075–2086. - PubMed
Publication types
MeSH terms
Substances
Grants and funding
LinkOut - more resources
Full Text Sources
Other Literature Sources
Molecular Biology Databases
