. 2017 Mar;15(3):331-343.
doi: 10.1111/pbi.12628. Epub 2016 Sep 23.

Down-regulation of GIGANTEA-like genes increases plant growth and salt stress tolerance in poplar

Affiliations

Down-regulation of GIGANTEA-like genes increases plant growth and salt stress tolerance in poplar

Qingbo Ke et al. Plant Biotechnol J. 2017 Mar.

Abstract

The flowering time regulator GIGANTEA (GI) connects networks involved in developmental stage transitions and environmental stress responses in Arabidopsis. However, little is known about the role of GI in growth, development and responses to environmental challenges in the perennial plant poplar. Here, we identified and functionally characterized three GI-like genes (PagGIa, PagGIb and PagGIc) from poplar (Populus alba × Populus glandulosa). PagGIs are predominantly nuclear localized and their transcripts are rhythmically expressed, with a peak around zeitgeber time 12 under long-day conditions. Overexpressing PagGIs in wild-type (WT) Arabidopsis induced early flowering and salt sensitivity, while overexpressing PagGIs in the gi-2 mutant completely or partially rescued its delayed flowering and enhanced salt tolerance phenotypes. Furthermore, the PagGIs-PagSOS2 complexes inhibited PagSOS2-regulated phosphorylation of PagSOS1 in the absence of stress, whereas these inhibitions were eliminated due to the degradation of PagGIs under salt stress. Down-regulation of PagGIs by RNA interference led to vigorous growth, higher biomass and enhanced salt stress tolerance in transgenic poplar plants. Taken together, these results indicate that several functions of Arabidopsis GI are conserved in its poplar orthologues, and they lay the foundation for developing new approaches to producing salt-tolerant trees for sustainable development on marginal lands worldwide.

Keywords: Arabidopsis; PagGI; RNAi; poplar; salt tolerance; transgenic plants.


Figures

Figure 1
Figure 1
GIGANTEA like Genes in Poplar. (a) Phylogenetic analysis of poplar GIGANTEA‐like genes. (b) Comparison of the amino acid sequences of nuclear localization regions of poplar and Arabidopsis GI. The alignment was performed using BioEdit and BoxShade server. Identical and similar amino acid residues are shaded in black and grey respectively. The nuclear localization sites are indicated by red boxes. (c) Subcellular localization of PagGIa‐, b‐ and c‐GFP fusion proteins. DAPI (second row) and GFP (third row) fluorescence was observed at 3 days after infiltration. Both fluorescence images are merged in the fourth row (merge). Scale bars represent 50 μM.
Figure 2
Figure 2
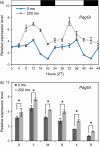
PagGIa, b and c are Involved in the Regulation of Circadian Rhythms. (a) Time course of PagGI expression in mature leaves of poplar plants under LDs. (b) Expression levels of PagGI in different tissues at ZT12. Total RNA samples were collected every 4 h from 2‐month‐old poplar plants entrained in LDs of 48 h with or without 200 mm NaCl treatments. The mRNA abundance was quantified by quantitative RTPCR, which was performed in triplicate with three independently harvested samples. Actin expression was used as an internal control. Detected tissues including shoot tip (S), young leaf (Y), mature leaf (M), bark (B), xylem (X) and root (R). White and black bars above the graph indicate day and night periods respectively. Error bars represent SD of three independent experiments. Asterisks indicate significant differences at < 0.05.
Figure 3
Figure 3
Overexpression of PagGI Genes Induces Early Flowering in Transgenic Arabidopsis (T3 Generation). (a) Flowering phenotype of 35S:PagGIa/b/c Col‐0 (overexpression lines) and 35S:PagGIa/b/c gi2 (complemented lines). Three‐day‐old seedlings were transferred from MS basal medium to MS medium without (0 mm) or with 50 mm NaCl. Plants were grown under LDs and photographed at 5 weeks. Flowering time was scored by counting the number of leaves (rosette and cauline) (b) and measuring the days to bolting (c) when bolted main stems were ~1 cm long. More than 10 plants were measured per data point. Error bars represent SD of three independent experiments. Asterisks indicate significant differences at < 0.05.
Figure 4
Figure 4
Overexpression of PagGI Genes Confers Salt Sensitivity in Transgenic Arabidopsis. (a) 35S:PagGIa/b/c Col‐0 (overexpression lines) and 35S:PagGIa/b/c gi2 (complemented lines) plants were grown in soil under LDs for 3 weeks (first row, before) and then (after) watered with water (0 mm NaCl) for 1 week (second row) or 150 mm NaCl solution for 1 week (third row) or 2 weeks (fourth row), and (b) relative fresh weights at the end of the treatments (shown in a) were measured. More than 10 plants were measured per data point. Error bars represent SD of three independent experiments. Asterisks indicate significant differences at < 0.05.
Figure 5
Figure 5
PagGI Proteins Negatively Regulate Salinity Stress Tolerance. (a) His pull‐down assay to examine the association between PagGI proteins and PagSOS2 in vitro. For input, the protein extracts were analysed by SDSPAGE, followed by western blotting with the indicated antibodies (α‐His, second row; α‐GST, third row). For output, the protein extracts were incubated overnight with His‐agarose beads. After extensive washing, bound proteins were analysed as above with antibodies against GST‐tag (α‐GST, first row). (b) BIFC assay to monitor the interaction between PagGI proteins and PagSOS2 in vivo. DAPI (second row) and Venus (third row) fluorescence was observed at 3 days after infiltration. Both fluorescence images are merged in the fourth row (merge). Scale bars represent 50 μM.
Figure 6
Figure 6
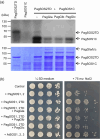
PagGI proteins negatively regulate salinity stress tolerance. (a) PagGIa/b/c inhibit PagSOS2‐mediated PagSOS1 phosphorylation in vitro. An in vitro kinase assay was performed using purified bacterially GST‐PagSOS1C, GST‐PagSOS2TD and His‐PagGI a, b, and c proteins in the indicated combinations. Shown are autoradiogram (top panel) and CBB staining (bottom panel) of a gel containing resolved reactions. (b) PagGIs decrease the NaCl tolerance of yeast expressing the auto‐phosphorylated PagSOS2 (PagSOS2TD)and PagSOS1 ion transporter. Yeast strain AXT3K cells transformed with an empty vector (control) or indicated combination of genes were grown overnight in liquid selective medium. Five microlitres of serial decimal dilutions were spotted onto plates of the same medium or supplemented with 75 mm NaCl. Plates were incubated at 28 °C and photographed after 4 days.
Figure 7
Figure 7
PagGIa, b and c are degraded upon exposure to salt in a proteasome‐dependent manner. Whole 3‐week‐old, soil‐grown 35S:PagGIa/b/c Col‐0 plants were treated with NaCl (100 mm), MG132 (100 mm) or NaCl plus MG132 at ZT1. PagGIa, b and c protein levels were evaluated after 0, 12 and 24 h treatments via immunoblot analysis with anti‐GFP antibody. Coomassie Brilliant blue (CBB)‐stained blots are shown as a loading control. Molecular weight markers in kDa.
Figure 8
Figure 8
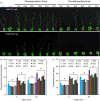
Morphological Phenotypes of RB Poplar Plants. (a) Schematic diagram of the constructs. (b) Plant phenotype of non‐transgenic (NT) and RB plants after 2 months of growth in pots. (c) The 8th leaf, (d) root morphology, (e) petiole length and (f, g) Stem diameter of 2‐month‐old NT and RB plants. Petiole length was determined in the 10th leaves. Stem diameter was measured from the position ~20 cm below the terminal bud. (h) The height and (i) dry weight of shoots and roots of 2‐month‐old poplar plants. (j) Transcript levels of auxin‐responsive IAA genes ( IAA1, IAA2, IAA4 and IAA5) were measured by quantitative RTPCR in the 10th leaves of 2‐month‐old NT and RB plants. The expression levels of IAA genes were normalized to the poplar actin gene as an internal control. Data represent three independent experiments. Asterisks and ns indicate significant and nonsignificant differences at < 0.05 respectively.
Figure 9
Figure 9
Down‐Regulation of PagGI Genes Confers Salt Tolerance in Poplar. (a) Effect of salt stress on RB poplar plants. Two‐month‐old non‐transgenic and RB plants were subjected to 200 mm NaCl treatment for 6 day and recovery for 15 day. (b) Transcript levels of PagGIs in three individual RB poplar plants. The 10th leaves from 1‐month‐old plants entrained in LDs were harvested at ZT12. The mRNA abundance was quantified by quantitative RTPCR and normalized to the level of poplar actin transcript. (c) Fv/Fm and total Chl contents in the leaves (10th) of poplar plants were determined at 4 day after treatment. Data represent means ± SD of three independent experiments. Asterisks indicate significant differences at < 0.05 respectively.
Figure 10
Figure 10
Model of the Roles of PagGI Genes in Regulating Circadian Rhythms, Flowering Time and the Salt Stress Response.

Similar articles

Cited by

References

    1. Andrés, F. and Coupland, G. (2012) The genetic basis of flowering responses to seasonal cues. Nat. Rev. Genet. 13, 627–639. - PubMed
    1. Ardie, S.W. , Xie, L. , Takahashi, R. , Liu, S. and Takano, T. (2009) Cloning of a high‐affinity K+ transporter gene PutHKT2; 1 from Puccinellia tenuiflora and its functional comparison with OsHKT2; 1 from rice in yeast and Arabidopsis . J. Exp. Bot. 184, 1–2. - PMC - PubMed
    1. Bäurle, I. and Dean, C. (2006) The timing of developmental transitions in plants. Cell, 125, 655–664. - PubMed
    1. Böhlenius, H. , Huang, T. , Charbonnel‐Campaa, L. , Brunner, A.M. , Jansson, S. , Strauss, S.H. and Nilsson, O. (2006) CO/FT regulatory module controls timing of flowering and seasonal growth cessation in trees. Science, 312, 1040–1043. - PubMed
    1. Chen, S. , Hawighorst, P. , Sun, J. and Polle, A. (2014) Salt tolerance in Populus: significance of stress signaling networks, mycorrhization, and soil amendments for cellular and whole‐plant nutrition. Environ. Exp. Bot. 107, 113–124.

MeSH terms

LinkOut - more resources