Review
. 2017 Jan;32(1):215-232.
doi: 10.1093/mutage/gew037. Epub 2016 Aug 26.

Emerging metrology for high-throughput nanomaterial genotoxicology

Affiliations
Review

Emerging metrology for high-throughput nanomaterial genotoxicology

Bryant C Nelson et al. Mutagenesis. 2017 Jan.

Abstract

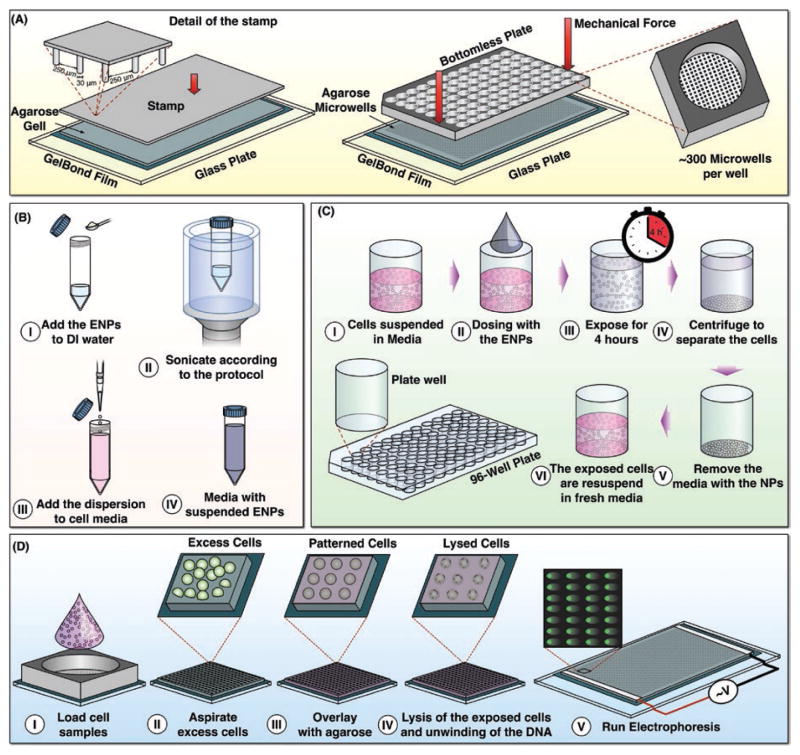
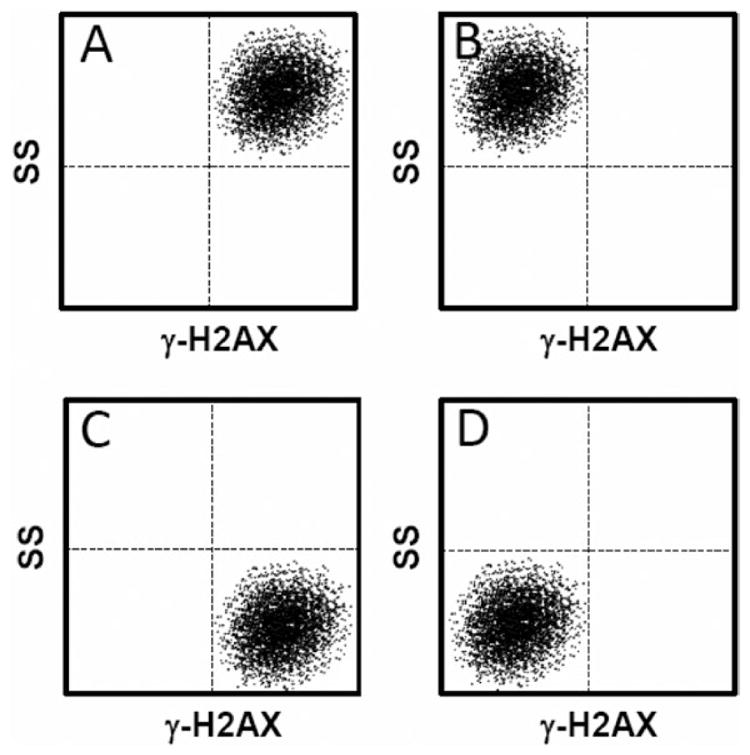
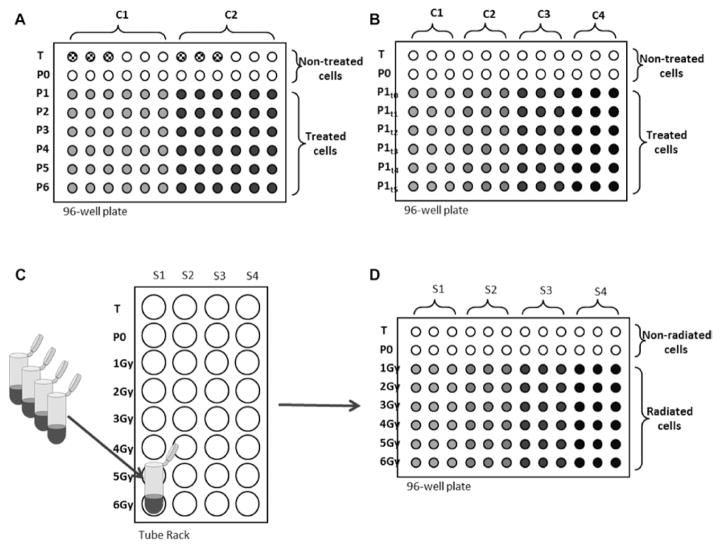
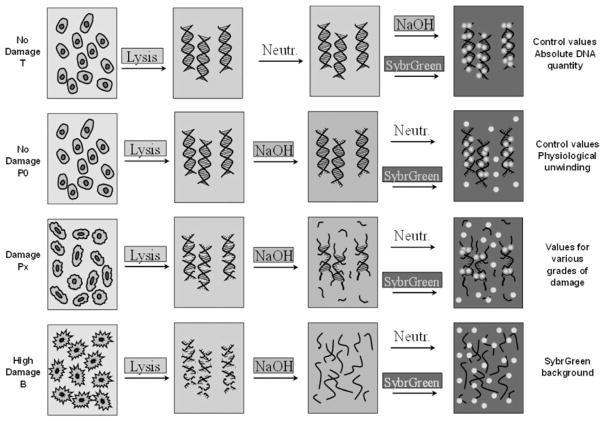
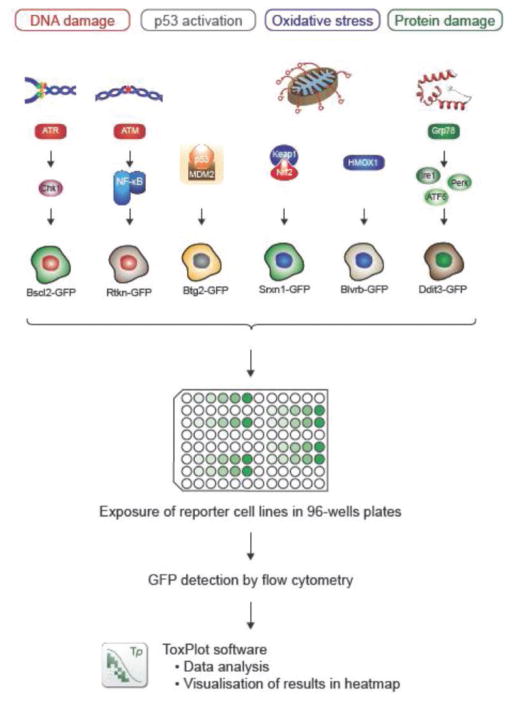
The rapid development of the engineered nanomaterial (ENM) manufacturing industry has accelerated the incorporation of ENMs into a wide variety of consumer products across the globe. Unintentionally or not, some of these ENMs may be introduced into the environment or come into contact with humans or other organisms resulting in unexpected biological effects. It is thus prudent to have rapid and robust analytical metrology in place that can be used to critically assess and/or predict the cytotoxicity, as well as the potential genotoxicity of these ENMs. Many of the traditional genotoxicity test methods [e.g. unscheduled DNA synthesis assay, bacterial reverse mutation (Ames) test, etc.,] for determining the DNA damaging potential of chemical and biological compounds are not suitable for the evaluation of ENMs, due to a variety of methodological issues ranging from potential assay interferences to problems centered on low sample throughput. Recently, a number of sensitive, high-throughput genotoxicity assays/platforms (CometChip assay, flow cytometry/micronucleus assay, flow cytometry/γ-H2AX assay, automated 'Fluorimetric Detection of Alkaline DNA Unwinding' (FADU) assay, ToxTracker reporter assay) have been developed, based on substantial modifications and enhancements of traditional genotoxicity assays. These new assays have been used for the rapid measurement of DNA damage (strand breaks), chromosomal damage (micronuclei) and for detecting upregulated DNA damage signalling pathways resulting from ENM exposures. In this critical review, we describe and discuss the fundamental measurement principles and measurement endpoints of these new assays, as well as the modes of operation, analytical metrics and potential interferences, as applicable to ENM exposures. An unbiased discussion of the major technical advantages and limitations of each assay for evaluating and predicting the genotoxic potential of ENMs is also provided.


Conflict of interest statement

Conflict of interest statement: G.H. is the CEO of Toxys, a Dutch biotech company that offers the ToxTracker assay as a commercial service to industry.

Figures

Figure 1
Figure 1
CometChip Platform Assembly and Protocol. (A) Using a microfabricated stamp, microwells are created in molten agarose. Once the agarose gel is set, the stamp is removed revealing patterned microwells. To create individual conditions or exposures, a bottomless 96-well plate is placed on the gel and secured. (B) ENM suspensions are prepared in distilled water by using sonication energy to reduce agglomerate size. (C) ENM exposure to either suspension or adherent cells occurs in a separate 96-well plate for 4 or 24 h. (D) The ENM-exposed cells are loaded into the microwells within the CometChip and electrophoresis is performed. The CometChip is then imaged using an automated imager or microscope. Images are then scored using MatLab software.
Figure 2
Figure 2
Hypothetical flow cytometry dot plot patterns for SS versus γ-H2AX responses after treatment with ENMs. The dot plot patterns are divided into four groups; (A) high uptake of ENMs and high genotoxicity (γ-H2AX), (B) high uptake and low genotoxicity, (C) low uptake and high genotoxicity, (D) low uptake and low genotoxicity.
Figure 3
Figure 3
Schematic representation of three different experimental layouts for analysis of DNA strand breaks using the automated FADU assay. (A) Cells attached to a 96-well plate are treated with two different compounds (C1 and C2) in six different concentrations (P1–P6). T and P0 are untreated controls; P0 represents the endogenous amount of DNA strand breaks and T the total DNA amount. In this example, three wells of T values are designated to assess the interference of compounds or solvents used with the fluorescence signal. For this purpose, cells are treated with the compound and/or solvents and compared to the untreated T values. This layout allows six replicates for conditions P0–P6 and three replicates for treated T and untreated T values, respectively. (B) Cells attached to a 96-well plate are treated with four different compounds (C1–C4) in one single concentration (P1). After damage occurs (P1t0), cells were incubated for different repair times (P1t1–Pt5). T and P0 are untreated controls; P0 represents the endogenous amount of DNA strand breaks and T the total DNA amount. This layout allows three replicates for each condition. (C) Lymphocytes from four different subjects (S1–S4) are irradiated in 2 ml tubes with doses ranging from 1 to 6 Gy. Cooled tube rack is placed in the liquid handling device (LHD) workspace and (D) samples are transferred to a pre-cooled 96-well plate. T and P0 represent non-radiated cells. This layout allows three replicates for each condition.
Figure 4
Figure 4
Principle of the FADU assay (schematic representation). Left boxes represent cells without (T and P0) or with (Px and B) DNA damage. In the middle boxes the dsDNA with increasing levels of damage and increasing extent of unwinding is represented. Right boxes contain small circles representing the fluorescent dye SybrGreen®.T, P0 und B are controls. T values the total DNA amount (100 % fluorescence), P0 values represent endogenous DNA strand breaks and B values represent the background fluorescence. Px values (P1, P2, P3, P4 Px) are the different extents of damage to be measured. After treatment cells are lysed and DNA is exposed to alkaline unwinding (NaOH). Neutralisation buffer stops the unwinding and SybrGreen® stains the dsDNA. Reprinted with permission from Steinberg, P. (ed.), High-Throughput Methods inToxicityTesting. John Wiley and Sons, Hoboken, pp. 285–294).
Figure 5
Figure 5
The ToxTracker assay applies a panel of six independent GFP-based reporter cell lines for detection of DNA damage, oxidative stress and protein unfolding. ToxTracker identifies activation of the ATR and Nf-KB-associated DNA damage responses by the Bscl2-GFP and Rtkn-GFP reporters, respectively. Induction of oxidative stress is established by the Srxn1-GFP and Blvrb-GFP reporters. The Ddit3-GFP reporter indicates activation of the unfolded protein response and the Btg2-GFP reporter detects activation of the p53 cellular stress response. Induction of the GFP reporters, as well as cytotoxicity, is determined by flow cytometry. Data analysis and visualisation of the results are performed by the Toxplot software platform.

References

    1. Lux report. [accessed April 2016];Nanomaterials state of the market: Nanotechnology update: Corporations up their spending as revenues for nano-enabled products increase excerpt. https://portal.Luxresearchinc.Com/research/report_excerpt/16215.
    1. Nel A, Xia T, Mädler L, Li N. Toxic potential of materials at the nanolevel. Science. 2006;311:622–627. - PubMed
    1. Nel A, Xia T, Meng H, Wang X, Lin S, Ji Z, Zhang H. Nanomaterial toxicity testing in the 21st century: use of a predictive toxicological approach and high-throughput screening. Acc Chem Res. 2013;46:607–621. - PMC - PubMed
    1. Damoiseaux R, George S, Li M, et al. No time to lose–high throughput screening to assess nanomaterial safety. Nanoscale. 2011;3:1345–1360. - PMC - PubMed
    1. Cho WS, Duffin R, Bradley M, Megson IL, MacNee W, Lee JK, Jeong J, Donaldson K. Predictive value of in vitro assays depends on the mechanism of toxicity of metal oxide nanoparticles. Part Fibre Toxicol. 2013;10:55. - PMC - PubMed

Publication types