

Increasing fetal ovine number per gestation alters fetal plasma clinical chemistry values
- PMID: 27565903
- PMCID: PMC5002913
- DOI: 10.14814/phy2.12905
Increasing fetal ovine number per gestation alters fetal plasma clinical chemistry values
Abstract
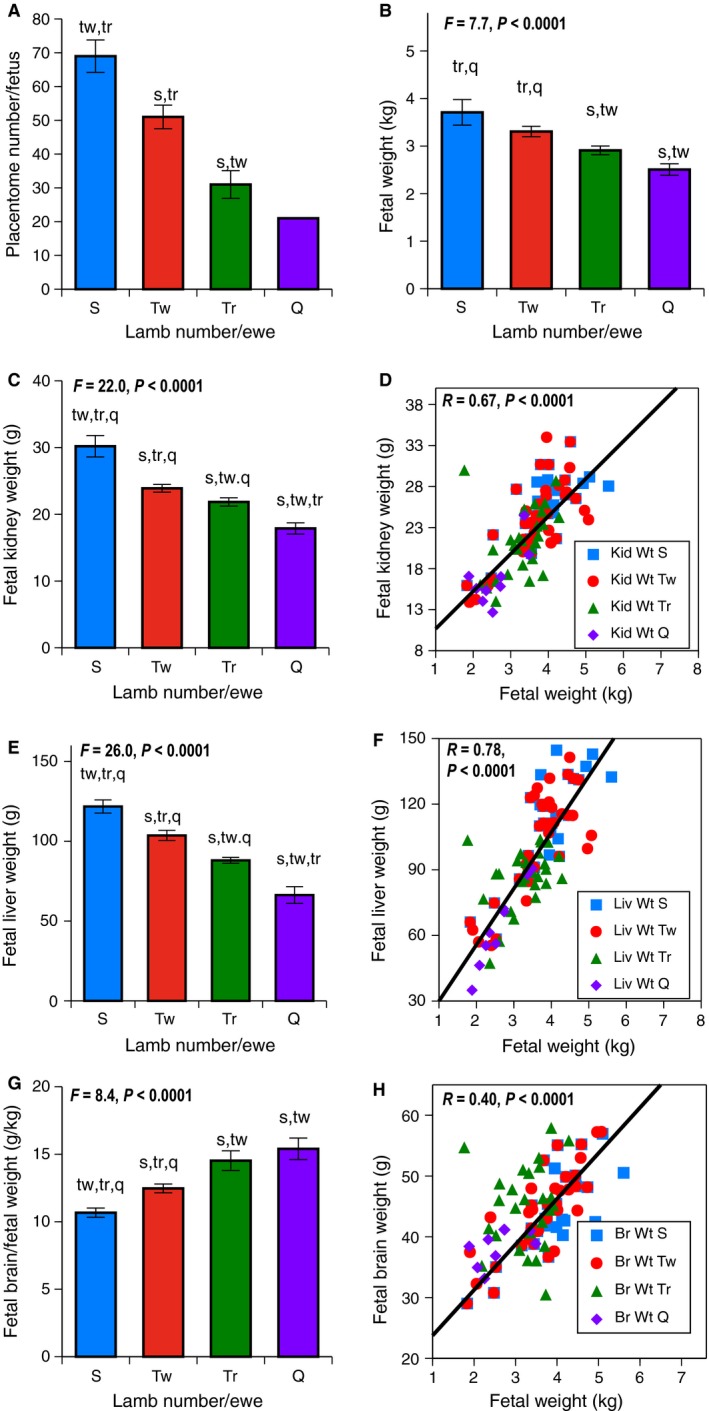
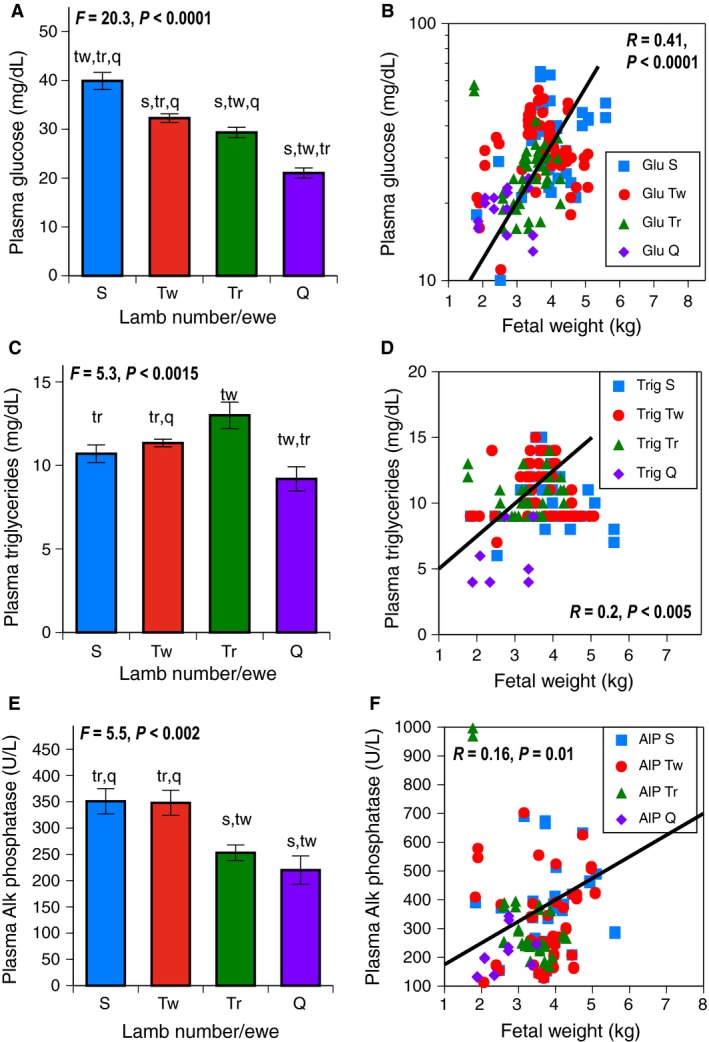
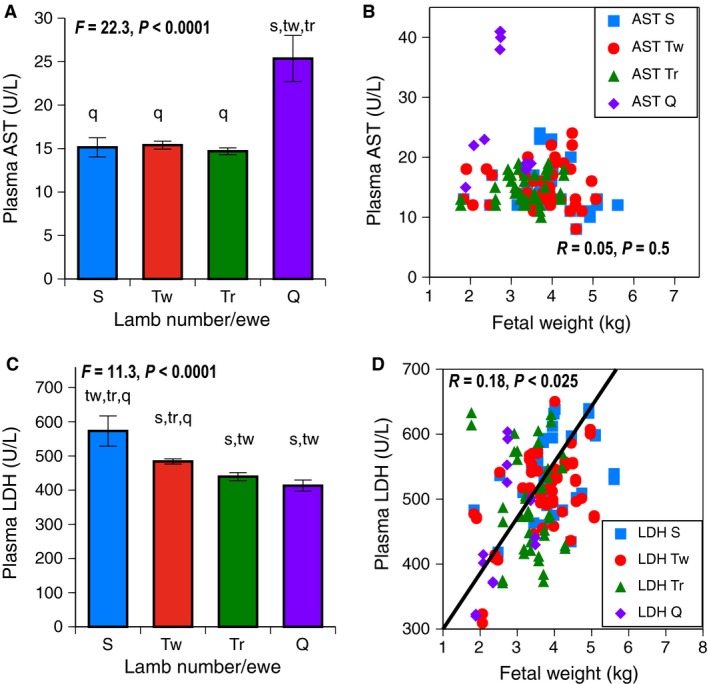
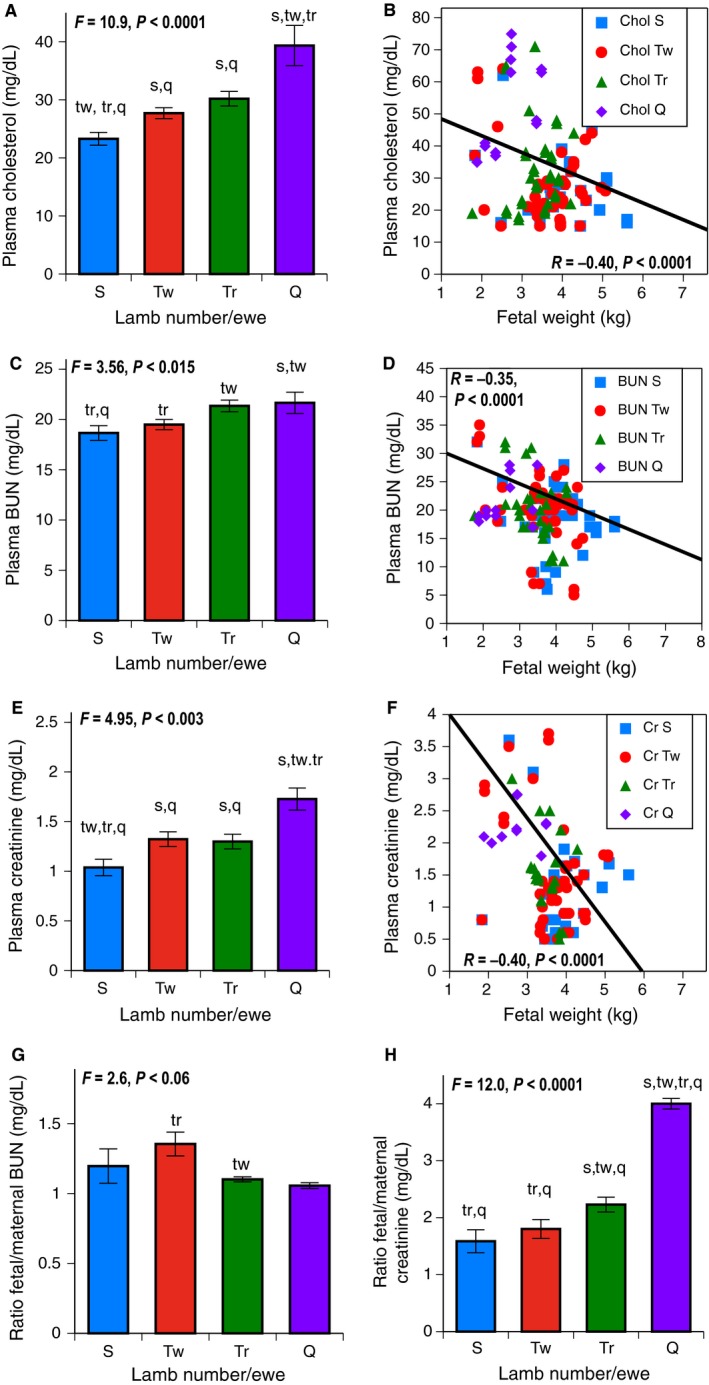
Intrauterine growth restriction (IUGR) is interconnected with developmental programming of lifelong pathophysiology. IUGR is seen in human multifetal pregnancies, with stepwise rises in fetal numbers interfering with placental nutrient delivery. It remains unknown whether fetal blood analyses would reflect fetal nutrition, liver, and excretory function in the last trimester of human or ovine IUGR In an ovine model, we hypothesized that fetal plasma biochemical values would reflect progressive placental, fetal liver, and fetal kidney dysfunction as the number of fetuses per gestation rose. To determine fetal plasma biochemical values in singleton, twin, triplet, and quadruplet/quintuplet ovine gestation, we investigated morphometric measures and comprehensive metabolic panels with nutritional measures, liver enzymes, and placental and fetal kidney excretory measures at gestational day (GD) 130 (90% gestation). As anticipated, placental dysfunction was supported by a stepwise fall in fetal weight, fetal plasma glucose, and triglyceride levels as fetal number per ewe rose. Fetal glucose and triglycerides were directly related to fetal weight. Plasma creatinine, reflecting fetal renal excretory function, and plasma cholesterol, reflecting placental excretory function, were inversely correlated with fetal weight. Progressive biochemical disturbances and growth restriction accompanied the rise in fetal number. Understanding the compensatory and adaptive responses of growth-restricted fetuses at the biochemical level may help explain how metabolic pathways in growth restriction can be predetermined at birth. This physiological understanding is important for clinical care and generating interventional strategies to prevent altered developmental programming in multifetal gestation.
Keywords: Fetal; nutrition; ovine; placenta.
© 2016 The Authors. Physiological Reports published by Wiley Periodicals, Inc. on behalf of the American Physiological Society and The Physiological Society.
Figures
Similar articles
-
Ovine surgical model of uterine space restriction: interactive effects of uterine anomalies and multifetal gestations on fetal and placental growth.Biol Reprod. 2010 Nov;83(5):799-806. doi: 10.1095/biolreprod.110.085381. Epub 2010 Jun 23. Biol Reprod. 2010. PMID: 20574052 Free PMC article.
-
Identification of Pathways Associated with Placental Adaptation to Maternal Nutrient Restriction in Sheep.Genes (Basel). 2020 Sep 2;11(9):1031. doi: 10.3390/genes11091031. Genes (Basel). 2020. PMID: 32887397 Free PMC article.
-
Leptin in the ovine fetus correlates with fetal and placental size.Am J Obstet Gynecol. 2001 Oct;185(4):786-91. doi: 10.1067/mob.2001.117313. Am J Obstet Gynecol. 2001. PMID: 11641652
-
Placental-fetal interrelationship in IUGR fetuses--a review.Placenta. 2002 Apr;23 Suppl A:S136-41. doi: 10.1053/plac.2002.0802. Placenta. 2002. PMID: 11978072 Review.
-
Nutritionally mediated placental growth restriction in the growing adolescent: consequences for the fetus.Biol Reprod. 2004 Oct;71(4):1055-62. doi: 10.1095/biolreprod.104.030965. Epub 2004 Jun 16. Biol Reprod. 2004. PMID: 15201203 Review.
Cited by
-
Dousing the flame: reviewing the mechanisms of inflammatory programming during stress-induced intrauterine growth restriction and the potential for ω-3 polyunsaturated fatty acid intervention.Front Physiol. 2023 Sep 1;14:1250134. doi: 10.3389/fphys.2023.1250134. eCollection 2023. Front Physiol. 2023. PMID: 37727657 Free PMC article. Review.
-
Impact of the ovarian cycle and pregnancy on plasma chemistry values in ewes.J Vet Diagn Invest. 2018 Mar;30(2):238-244. doi: 10.1177/1040638717752217. Epub 2018 Jan 2. J Vet Diagn Invest. 2018. PMID: 29291683 Free PMC article.
-
Hypoxia and Oxidative Stress Are Associated with Reduced Fetal Growth in Twin and Undernourished Sheep Pregnancies.Animals (Basel). 2018 Nov 19;8(11):217. doi: 10.3390/ani8110217. Animals (Basel). 2018. PMID: 30463237 Free PMC article.
-
Effects of the fat-tailed ewes' body condition scores at lambing on their metabolic profile and offspring growth.Arch Anim Breed. 2020 Jun 24;63(1):183-191. doi: 10.5194/aab-63-183-2020. eCollection 2020. Arch Anim Breed. 2020. PMID: 32760785 Free PMC article.
-
Ovine uterine space restriction causes dysregulation of the renin-angiotensin system in fetal kidneys.Biol Reprod. 2017 Jan 1;96(1):211-220. doi: 10.1095/biolreprod.116.140079. Biol Reprod. 2017. PMID: 28395333 Free PMC article.
References
-
- Alvino, G. , Cozzi V., Radaelli T., Ortega H., Herrera E., and Cetin I.. 2008. Maternal and fetal fatty acid profile in normal and intrauterine growth restriction pregnancies with and without preeclampsia. Pediatr. Res. 64:615–620. - PubMed
-
- Anderson, R. J. , O'brien M., MaWhinney S., VillaNueva C. B., Moritz T. E., Sethi G. K., Henderson W. G., Hammermeister K. E., Grover F. L., and Shroyer A. L.. 1999. Renal failure predisposes patients to adverse outcome after coronary artery bypass surgery. VA Cooperative Study #5. Kidney Int. 55:1057–1062. - PubMed
-
- Anthony, R. V. , Scheaffer A. N., Wright C. D., and Regnault T. R.. 2003. Ruminant models of prenatal growth restriction. Reprod Suppl. 61:183–194. - PubMed
-
- Arad, I. , Bar‐Oz B., and Peleg O.. 2001. Early plasma creatinine values in discordant twins. Twin Res. 4:215–218. - PubMed
-
- Barker, D. J. 1992. Fetal growth and adult disease. Br. J. Obstet. Gynaecol. 99:275–276. - PubMed
Publication types
MeSH terms
Grants and funding
LinkOut - more resources
Full Text Sources
Other Literature Sources
Medical
Research Materials
