. 2016 Dec 1;44(21):e160.
doi: 10.1093/nar/gkw744. Epub 2016 Aug 26.

Single molecule tracking of Ace1p in Saccharomyces cerevisiae defines a characteristic residence time for non-specific interactions of transcription factors with chromatin

Affiliations

Single molecule tracking of Ace1p in Saccharomyces cerevisiae defines a characteristic residence time for non-specific interactions of transcription factors with chromatin

David A Ball et al. Nucleic Acids Res. .

Abstract

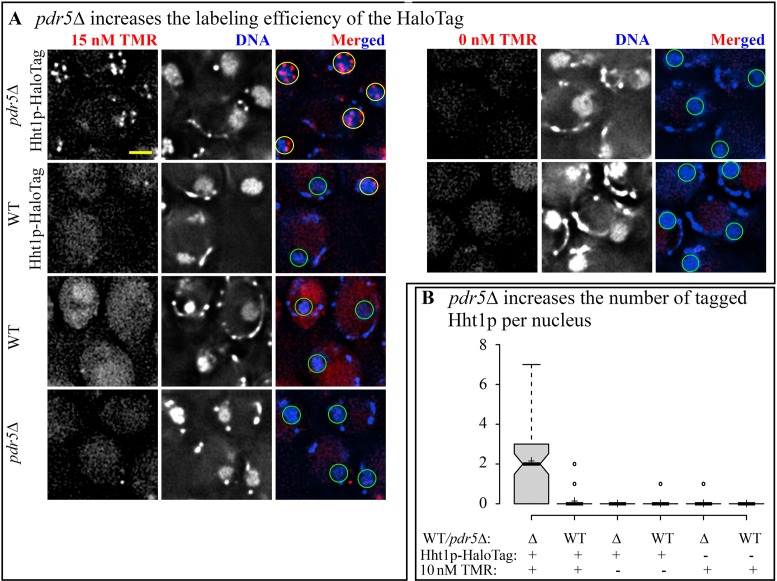
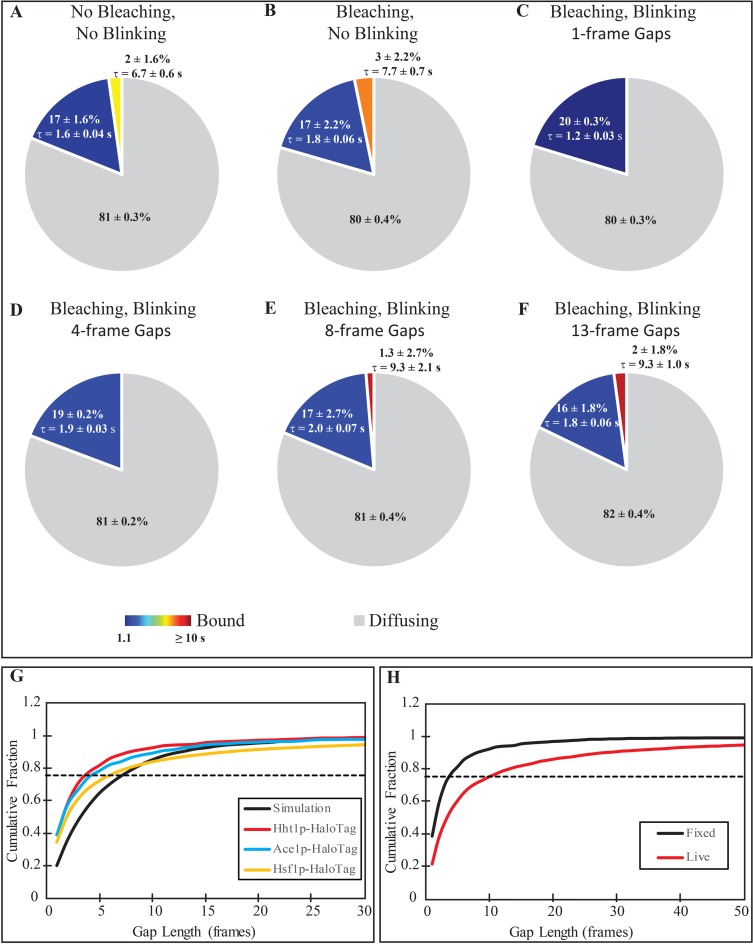
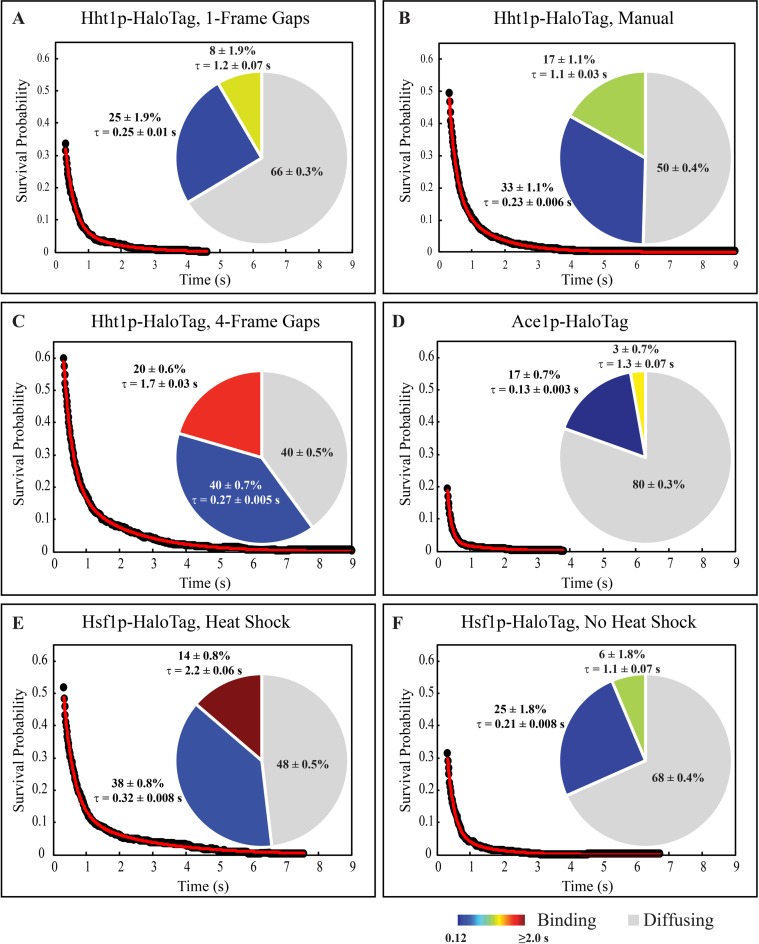
In vivo single molecule tracking has recently developed into a powerful technique for measuring and understanding the transient interactions of transcription factors (TF) with their chromatin response elements. However, this method still lacks a solid foundation for distinguishing between specific and non-specific interactions. To address this issue, we took advantage of the power of molecular genetics of yeast. Yeast TF Ace1p has only five specific sites in the genome and thus serves as a benchmark to distinguish specific from non-specific binding. Here, we show that the estimated residence time of the short-residence molecules is essentially the same for Hht1p, Ace1p and Hsf1p, equaling 0.12-0.32 s. These three DNA-binding proteins are very different in their structure, function and intracellular concentration. This suggests that (i) short-residence molecules are bound to DNA non-specifically, and (ii) that non-specific binding shares common characteristics between vastly different DNA-bound proteins and thus may have a common underlying mechanism. We develop new and robust procedure for evaluation of adverse effects of labeling, and new quantitative analysis procedures that significantly improve residence time measurements by accounting for fluorophore blinking. Our results provide a framework for the reliable performance and analysis of single molecule TF experiments in yeast.


Figures

Figure 1.
Figure 1.
Disruption of PDR5 increases efficiency of TMR staining of Hht1p-HaloTag cells. (A) Live cells of WT (YTK1479), WT Hht1p-HaloTag (YTK1490), pdr5Δ Hht1p-HaloTag (YTK1491) and pdr5Δ (YTK1492) were treated with 15 nM TMR/0 nM TMR and DAPI. Single focal plane (SFP) images were acquired on DeltaVision Elite microscope; TMR images were deconvolved. All images in the TMR channel are scaled equally. Yellow circles represent nuclei with TMR particles, whereas green circles represent nuclei without TMR particles. Scale bar = 2 μm. (B) Particles from the TMR channel were counted for 10 nM TMR/0 nM TMR. Center lines show the median values; box limits indicate the 25th and 75th percentiles, outliers are represented by dots; crosses represent sample means. N ranges from 83 to 105.
Figure 2.
Figure 2.
Overview of the steps involved in kymograph-based tracking of single molecules of Hht1p-HaloTag labeled with JF646. Imaging is done on HILO microscope. (A) Projection of the intensity summed over all 300 frames of a representative movie to visualize all particles in the 647 nm channel. (B) Same projection as in (A) after noise reduction with the band-pass filtering module of the software. (C) Summed intensity projection of the same field-of-view as in (A) in the 561 nm channel to visualize nuclei. Red outlines indicate user-identified ROIs in which particle tracking is performed. (D) Overlay of 647 nm (red) and 561 nm (green) channels demonstrating particles residing in the nuclei. (E and F) Kymographs XT, (E) Y-projections, and YT, (F) X-projection of all 300 frames from the movie shown in (B) after filtering. Both kymographs are used for manual correction of tracks because apparent track overlap in one dimension resulting from particles in different nuclei are typically well-separated in the other dimension. Colored arrows indicate the corresponding particles shown in the summed image displayed in (B). Examples of (G and H) correctly autodetected and (I and J) manually edited tracks shown as kymographs. (G) The software successfully identifies tracks that are continuous or contain gaps of a single frame. Red, green and blue spots indicate three separate tracks from this image. (H) The algorithm also identifies freely diffusing molecules, which are characterized by a bright spot in a single frame with dimmer (usually not autodetected) spots in the preceding and/or following frames. (I) If a track contains gaps of several frames, the user must manually join the autodetected track segments. (J) Over-crowding makes it challenging to follow a single particle, and so these types of tracks are typically thrown out. See text for our recommendations on when to merge track segments as in (I), or leave them separated as in (G).
Figure 3.
Figure 3.
Disruption of PDR5 does not alter the normal physiology of the cell in contrast to electroporation. (A) Dynamics of Ace1p-3xGFP occupancy on CUP1 array were assayed by counting the number of cells with visible CUP1 arrays observed over time with 4-min time intervals in PDR5 Ace1p-3xGFP (YTK1479), and pdr5Δ Ace1p-3xGFP (YTK1404). N > 100. Error bars represent standard error of the proportion (s.e.p). Arrows point to visible arrays in the representative diploid nucleus of PDR5 Ace1p-3xGFP. Scale bar = 2 μm. (B) PDR5 Ace1p-3xGFP (YTK1479) cells were observed on DeltaVision Elite microscope before and 5 min after electroporation (EP). Error bars represent the standard error of the mean (s.e.m.). Scale bar = 2 μm. (C) PDR5 Ace1p-3xGFP (YTK1479) were allowed to recover for 2 h before being treated with 100 μM CuSO4 to observe dynamics of Ace1p binding to the CUP1 promoters. Cells treated with TMR by electroporation (EP+TMR) were compared with Non-electroporated cells (No EP), treated and not treated with TMR. Error bars represent s.e.p. N ranges from 29 to 100.
Figure 4.
Figure 4.
Development of correction procedures for the blinking in tracking data. (A and B) Extracted distributions of unbound, short- and long-lived binding events for simulations of molecules without blinking, and (A) without, or (B) with photobleaching. (C–F) Extracted distributions of unbound, short- and long-lived binding events for simulation with blinking and photobleaching where tracking is performed by filling in gaps with a maximum length of (C) 1 frame, (D) 4 frames, (E) 13 frames and (F) 37 frames. For all distributions, the average residence times of the short and long binding events are included next to the appropriate slice with the 95% confidence interval. The 1-frame and 4-frame gap setting data were adequately fit with a single-component exponential, while the remaining data sets required a two-component exponential based on the results of an F-test comparing the 2 fits. (G) Cumulative distribution of gap lengths for simulations (black, solid), Hht1p-HaloTag (blue), Ace1p-HaloTag (red) and Hsf1p-HaloTag (yellow). The dashed line at a fraction of 0.75 is the cut-off value used to determine the number of frames within a gap to fill for each tracked protein. (H) Comparison of gap length distributions for Hht1p-HaloTag in fixed (black) and live (red) cells. The longer gaps present in live cells are believed to be due to dissociation/re-binding events.
Figure 5.
Figure 5.
DNA binding is protein- and environment-specific, (A–C) Raw survival distribution (black dots), the best fitting 2-component exponential decay (red line), and extracted distributions of diffusing, short and long binding events (pie chart) in Hht1p-HaloTag after (A) automated tracking filling in 1-frame gaps, (B) manual correction of the automated tracking in (A), and (C) automated tracking filling in gaps up to 4 frames. (D–F) Raw survival (black dots), best fit (red line), and distribution of binding events (pie chart) from automated tracking while filling in 4-frame gaps for (D) Ace1p-HaloTag, (E) Hsf1p-HaloTag in heat shock conditions, and (F) Hsf1p-HaloTag in absence of heat shock. For all distributions, the average residence times of the short and long binding events are included next to the appropriate slice with their 95% confidence interval. All distributions required a two-component exponential fit based on an F-test comparison between the one- and two-component fitting.

References

    1. McNally J.G., Muller W.G., Walker D., Wolford R., Hager G.L. The glucocorticoid receptor: Rapid exchange with regulatory sites in living cells. Science. 2000;287:1262–1265. - PubMed
    1. Karpova T.S., Kim M.J., Spriet C., Nalley K., Stasevich T.J., Kherrouche Z., Heliot L., McNally J.G. Concurrent fast and slow cycling of a transcriptional activator at an endogenous promoter. Science. 2008;319:466–469. - PubMed
    1. Voss Ty.C., Hager G.L. Dynamic regulation of transcriptional states by chromatin and transcription factors. Nat. Rev. 2014;15:69–81. - PMC - PubMed
    1. Morisaki T., Muller W.G., Golob N., Mazza D., McNally J.G. Single-molecule analysis of transcription factor binding at transcription sites in live cells. Nat. Commun. 2014;5:4456. - PMC - PubMed
    1. Mazza D., Abernathy A., Golob N., Morisaki T., McNally J.G. A benchmark for chromatin binding measurements in live cells. Nucleic Acid Res. 2012;40:e119. - PMC - PubMed

MeSH terms