. 2017 Apr 1;72(4):513-519.
doi: 10.1093/gerona/glw163.

Body Composition Remodeling and Mortality: The Health Aging and Body Composition Study

Affiliations

Body Composition Remodeling and Mortality: The Health Aging and Body Composition Study

Adam J Santanasto et al. J Gerontol A Biol Sci Med Sci. .

Abstract

Background: Age-related losses of lean mass and shifts to central adiposity are related to functional decline and may predict mortality and/or explain part of the risk of weight loss. To determine how mortality risk is related to shifts in body composition, changes should be considered in the context of overall weight change.

Methods: Five-year changes in body composition were assessed with computed tomography (cm2) and dual x-ray absorptiometry (kg) in 869 men and 934 women initially aged 70-79 years. All-cause mortality was monitored for up to 12 years (2002-2003 to September 30, 2014), and risk was assessed using sex-specific Cox models.

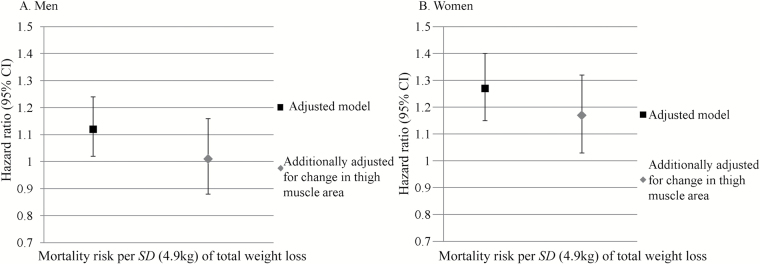
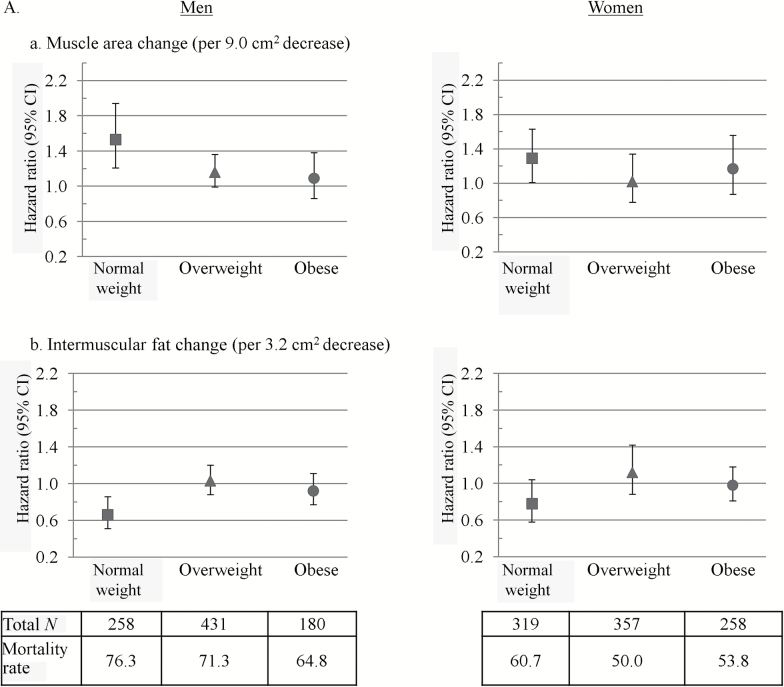
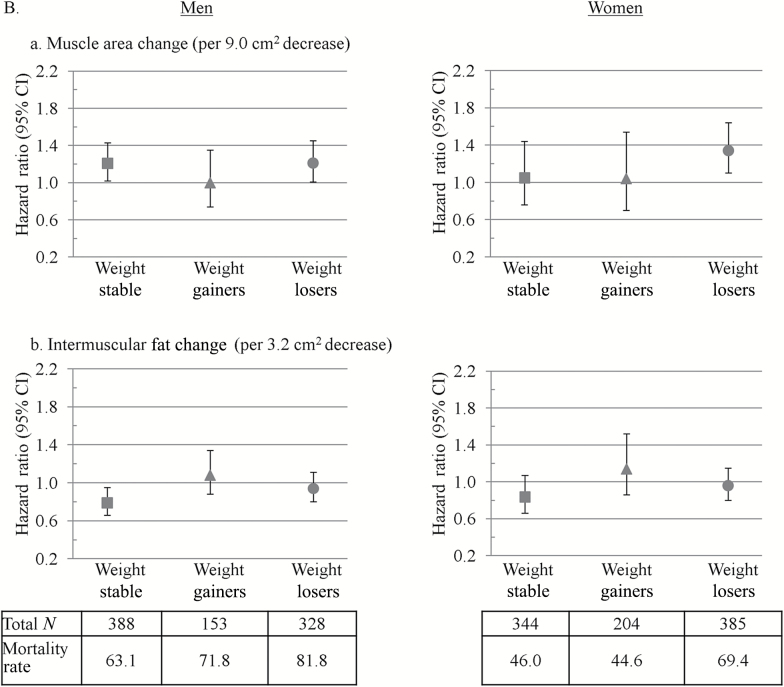
Results: Both men and women lost weight, visceral fat area, thigh muscle area, lean mass, and fat mass (all p < .01) but gained intermuscular thigh fat area (p < .01). There were 995 deaths. After adjustment for total weight change, demographics, and chronic disease, losing thigh muscle area was associated with higher mortality in both men (1.21, 1.08-1.35) and women (1.18, 1.01-1.37, per 9.0cm2) and was especially strong in normal weight (body mass index < 25kg/m2) individuals and those losing weight. Losing intermuscular thigh fat was protective against mortality only in normal weight (0.66, 0.51-0.86) and weight stable men (0.79, 0.66-0.95, per 3.2cm2). Changes in visceral fat area were not associated with mortality.

Conclusions: Older adults with greater loss of thigh muscle than expected for overall weight change had a higher mortality risk compared to those with relative thigh muscle preservation, suggesting that conservation of muscle mass is important for survival in old age.

Keywords: Body composition; Mortality; Muscle; Prospective cohort.


Figures

Figure 1.
Figure 1.
Hazard ratios for mortality associated with total weight loss before and after adjustment for thigh muscle area loss in men (A) and women (B). Hazard ratios are from Cox models and are per SD change over 5 years (4.9kg) with an increase in muscle area as the referent, adjusting for race, study site, physical activity, education (men only), smoking, baseline body composition measure, diabetes, cardiovascular disease, hypertension, chronic obstructive pulmonary disease (women only), depression (men only), Modified Mini-Mental State Examination score, and change in total body weight.
Figure 2.
Figure 2.
Hazard ratios for mortality associated with changes in (a) intermuscular fat and (b) thigh muscle in men and women by baseline (A) body mass index (BMI) and (B) weight change status. Hazard ratios are from Cox models and are per SD change over 5 years with an increase as the referent. Models were adjusted for age, race, study site, physical activity, education (men only), smoking, baseline body composition measure, diabetes, cardiovascular disease, hypertension, chronic obstructive pulmonary disease (women only), depression (men only), Modified Mini-Mental State Examination score, and change in total body weight. Mortality rates are deaths per 1,000 person years. Thigh muscle area and intermuscular fat were measured by computed tomography. BMI groups were defined as follows: normal weight (BMI < 25.0kg/m2), overweight (BMI = 25.0–29.9kg/m2), and obese (BMI ≥30kg/m2). p Values for BMI category by muscle and intermuscular fat change interactions on mortality were p = .04 and p = .12 in men and p = .57 and p = .36 in women, respectively. Weight change groups were defined as follows: weight stable (<3% weight change), weight gainers (≥3% weight increase), and weight losers (≥3% weight decrease). p Values for weight change direction by muscle and intermuscular fat change interactions on mortality were both p = .06 in men and p = .11 and p = .39 in women, respectively.
Figure 2.
Figure 2.
Hazard ratios for mortality associated with changes in (a) intermuscular fat and (b) thigh muscle in men and women by baseline (A) body mass index (BMI) and (B) weight change status. Hazard ratios are from Cox models and are per SD change over 5 years with an increase as the referent. Models were adjusted for age, race, study site, physical activity, education (men only), smoking, baseline body composition measure, diabetes, cardiovascular disease, hypertension, chronic obstructive pulmonary disease (women only), depression (men only), Modified Mini-Mental State Examination score, and change in total body weight. Mortality rates are deaths per 1,000 person years. Thigh muscle area and intermuscular fat were measured by computed tomography. BMI groups were defined as follows: normal weight (BMI < 25.0kg/m2), overweight (BMI = 25.0–29.9kg/m2), and obese (BMI ≥30kg/m2). p Values for BMI category by muscle and intermuscular fat change interactions on mortality were p = .04 and p = .12 in men and p = .57 and p = .36 in women, respectively. Weight change groups were defined as follows: weight stable (<3% weight change), weight gainers (≥3% weight increase), and weight losers (≥3% weight decrease). p Values for weight change direction by muscle and intermuscular fat change interactions on mortality were both p = .06 in men and p = .11 and p = .39 in women, respectively.

References

    1. Newman AB, Lee JS, Visser M, et al. Weight change and the conservation of lean mass in old age: the Health, Aging and Body Composition Study. Am J Clin Nutr. 2005;82:872–878; quiz 915. - PubMed
    1. Miljkovic I, Zmuda JM. Epidemiology of myosteatosis. Curr Opin Clin Nutr Metab Care. 2010;13:260–264. doi:10.1097/MCO.0b013e328337d826 - PMC - PubMed
    1. Vlassopoulos A, Combet E, Lean ME. Changing distributions of body size and adiposity with age. Int J Obes (Lond). 2014;38:857–864. doi:10.1038/ijo.2013.216 - PubMed
    1. Newman AB, Kupelian V, Visser M, et al. ; Health ABC Study Investigators Sarcopenia: alternative definitions and associations with lower extremity function. J Am Geriatr Soc. 2003;51:1602–1609. doi:10.1046/j.1532-5415.2003.51534.x - PubMed
    1. Rolland Y, Gallini A, Cristini C, et al. Body-composition predictors of mortality in women aged ≥75 y: data from a large population-based cohort study with a 17-y follow-up. Am J Clin Nutr. 2014;100:1352–1360. doi:10.3945/ajcn.114.086728 - PubMed